Test results are based on the Master’s thesis, “Comparison between Patient Spirometry and ventilator spirometry” by Saana Jenu, 20111
Introduction
The purpose of this document is to compare different spirometry measurement sites. The focus is on both ventilator spirometry, where gas samples are processed in the ventilator, and on patient spirometry, in which gas samples are processed at the end of the endotracheal (ET) tube, just outside the patient.
Basics of spirometry
Spirometry parameters are derived from pressure and/or flow measurements. Some possible measurement sites are shown in Figure 1
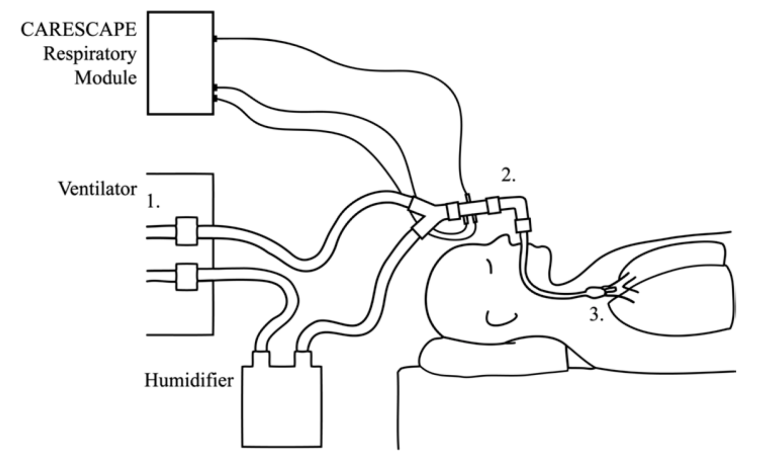
Figure 1. Spirometry measurement sites. Spirometry can be measured inside the ventilator (1) (ventilator spirometry) or closer to the patient: either next to the ET tube (2), as is done with the D-lite flow sensor (patient spirometry), or at the caudal end of the ET tube (3).
The D-lite™ flow sensor and gas sampler is used between the Y-piece and the ET tube. It features two ports designed for pressure measurement and one port for gas sampling. The design allows spirometry measurements as well as monitoring of CO2 , O2 , and anesthetic agents using a single integrated sensor. Spirometry parameters are computed in the CARESCAPE™ respiratory module. More detailed information about the sensor is available in the original publication2 . Measurement can also be performed inside the ventilator or at the caudal end of the ET tube.
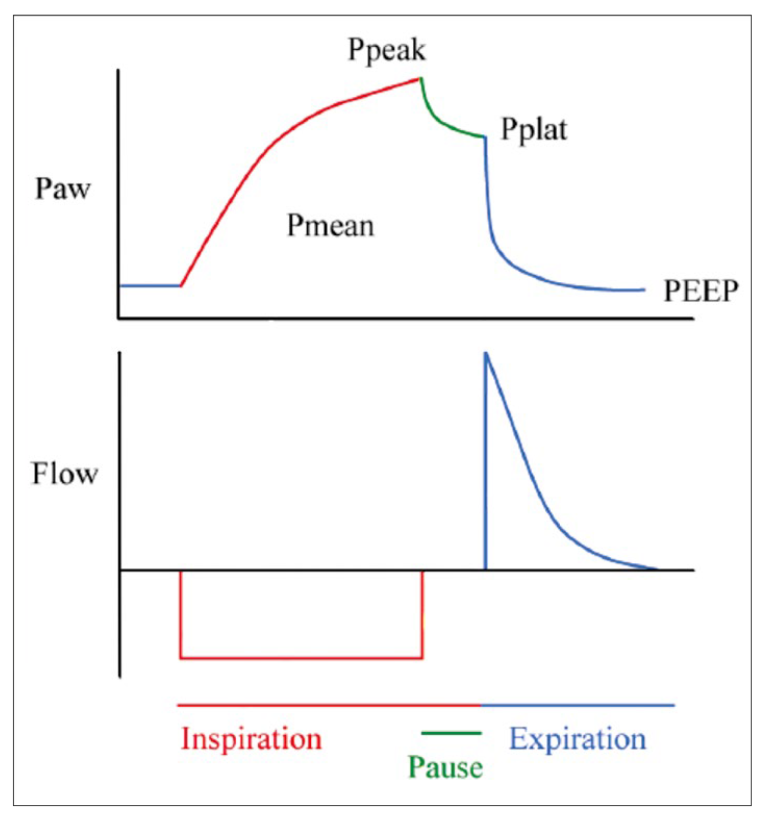
Figure 2 shows an example of how airway pressure and gas flow behave during one respiratory cycle in volume-controlled ventilation. During the inspiration phase, there is a constant flow from the ventilator to the patient circuit. As the lungs fill up, airway pressure (Paw) increases. At the end of the inspiration phase, maximum airway pressure (Pmax) is reached. During the inspiration pause the pressure decreases to a plateau value (Pplat). Finally, during the expiration phase, gas mixture flows towards the ventilator and airway pressure decreases. The remaining airway pressure at the end of the respiration cycle is called positive end-expiration pressure (PEEP). It consists of an intrinsic component (PEEPi ), which is caused by the air that is left inside the lungs after expiration, and an extrinsic component (PEEPe), which is the additional pressure maintained in the airway between breaths by the ventilator. We use PEEP to refer to the sum of the two components. Mean airway pressure over the respiratory cycle is called mean pressure (Pmean).
Inspiratory (TVinsp) and expiratory (TVexp) tidal volumes can be computed as time integrals of flow, and lung compliance is given by

Compliance describes how much the lungs and chest wall expand when pressure is applied in the patient airway. Airway resistance (Raw) is the system resistance of the patient airway and the tubing between the sensor and the lungs. It is related to the other parameters by

where V̇(t) refers to flow as a function of time.
Gas Conditions
Gas delivered by the ventilator is typically at room temperature and dry. A humidifier can be used for heating and humidifying the gas before inspiration. Expired gas is humid and at body temperature. Depending on the measurement site, the same sample of gas may have strikingly different properties.
To work out a simple example, suppose that no losses occur in the system. The ventilator is set to deliver a 500 ml breath (TVvent = 500 ml). The amount of dry gas that will be injected into the patient circuit is measured in atmospheric pressure (pD = 101.3 kPa) and room temperature (Troom = 21°C) to be exactly 500 ml.
Next, the gas mixture passes through a humidifier. Total pressure of the gas mixture is the sum of the partial pressure of the dry gases (pD) and water vapor (pH20). Saturated water vapor pressure at room temperature is 2.5 kPa. If no heating takes place the ideal gas law solved for inspired tidal volume (TVI) gives

If the volume is measured just before the gas mixture enters the ET tube, for example, with a D-lite sensor, this would be the correct reading.
Expired gas is humid and at body temperature (Tbody = 37°C). In Tbody, the partial pressure of water vapor is about 6.27 kPa. The ideal gas law can be written as

Subscripts I and E refer to inspired and expired quantities. Note that pD,E= pD,I and solve for TVe to obtain Ve = 562 ml. If TVe is measured when the gas mixture exits the ET tube, this is the correct reading.
The conditions can change further as the gas mixture cools down some degrees before it enters the ventilator. Thus, in ventilator spirometry, the expired tidal volume would again be different.
Even though all the calculated tidal volumes in this example are different, they are all correct, too. Patient spirometry values reflect more accurately what is entering and exiting the ET tube than ventilator spirometry values.
This was a simplified example. The effects of airway leaks, compliance of the circuit, and condensation of water were not considered. To obtain as precise measurements as possible, the measurement site should be selected so that possible sources of error will be minimized.
Error Sources in Spirometry
Typically it is important to know spirometry parameters of each breath in the patient’s lungs. The nearer to the lungs the measurements are made, the more accurate the results are. Indeed, pressure measurement at the caudal end of the ET tube has been shown to be more accurate than measurement in the patient airway3. However, this technique has not gained wide popularity because it requires an extra catheter inserted into the ET tube.
When the measurement site is taken farther away from the lungs, differences between measured quantities and those actually delivered to the lungs arise. Possible error sources include:
- Leaks in the patient circuit
- Leaks in the airway
- Leaking lungs
- Differences in gas conditions
- Pressure decrease due to resistance of the tubes
- Compression of gas in the circuit
- Tidal volume changes due to the compliance of the tubing
- Errors by measurement sensors
There may be leaks in the circuit between the ET tube and the ventilator. In that case only a part of the gas delivered by the ventilator actually enters the ET tube. In patient spirometry such leaks can be easily detected. However, leaks can also occur in the patient airway, meaning that a part of the gas does not enter the lungs but escapes through the airway.
The effect of gas conditions was described in the previous section. Technically, this is not an error source as long as the user is aware of the measurement and reporting conditions.
All the gas that is fed into the patient circuit does not reach the lungs even when leaks are not present. Resistance of the tubes causes pressure loss; the situation is analogous to electric potential decrease in a circuit due to electric resistance. If the resistance grows, for example, due to increase in tubing length or decrease in its diameter, the pressure losses also increase.
When the ventilator applies a pressure to the tubing, the volume of the gas mixture in the tubing decreases according to the ideal gas law (pressure * volume = constant). During inspiration, a part of the gas mixture remains compressed in the tubing and does not reach the patient. During expiration, the pressure drops and gas expands, and all the delivered gas flows back to the ventilator.
When a pressure is applied to an elastic tube, the walls will expand and increase the volume of the tube. As a result, a part of the gas delivered by the ventilator remains in the tubing and does not reach the patient.
Pressure decrease due to resistance of the tubes, compression of gas in the circuit, and compliance effects all depend on the amount of tubing between the patient and the measurement site. In patient spirometry the measurements are made just before the gas mixture enters or exits the ET tube. The resulting parameters are, thus, less prone to these error sources.
Literature Review
Compression and resistance losses depend on the tubing used. Such losses may be compensated with algorithms, but the adjustments are not always effective. Losses in the patient circuit can be substantial, for example, Coté et al. demonstrated that using compliant adult circuits may cause volume losses the size of pediatric tidal volume⁴. The configuration of the tubing may vary and the actual tubing may also change. These error sources are not present in patient spirometry.
A number of studies have been published on the accuracy of spirometry measurements made in different locations. Table 1 summarizes some findings on tidal volume parameters. The general finding is that ventilator spirometry produces values that differ substantially from values recorded in patient spirometry. These studies suggest that tidal volumes should be measured at the patient airway, regardless of the compliance compensation.
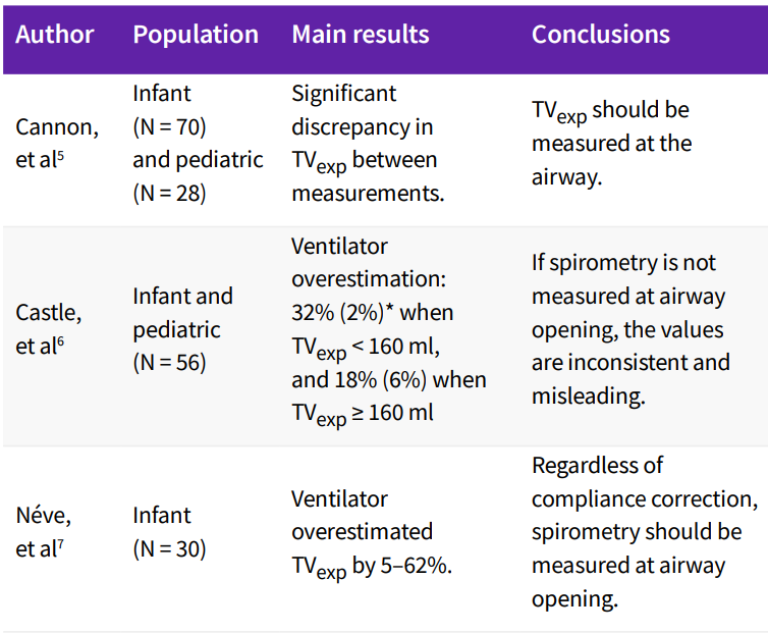
* Mean (Standard Deviation)
Al-Majed et al. reported that tidal volume measured at the ventilator was close to patient spirometry readings when compliance compensation was applied and no leaks were present. When the ET tube was leaking, tidal volumes measured at the ventilator were found inaccurate⁸. Heulitt et al reported that the ventilator overestimated tidal volume and, after compliance correction, underestimated it. Compensation did not improve results in small infants and children⁹.
There is neither theoretical nor empirical evidence that would support the view that ventilator spirometry could be consistently more accurate than patient spirometry. In patient spirometry, less error sources are present. Differences between the methods are most apparent when using small tidal volumes, the lung compliance is low, airway resistance is high, or when the tubing configuration is changed.
Néve et al. suggested that pressure also should be measured at the Y-piece with infants. This is especially important if they have increased respiratory system impedance, as overcompensation of TVexp was found to increase with decreasing lung compliance and increasing airway resistance⁶. Results on pressure parameters in general are more ambiguous. We present preliminary results from our own tests on pressure parameters.
Test Methods and Results
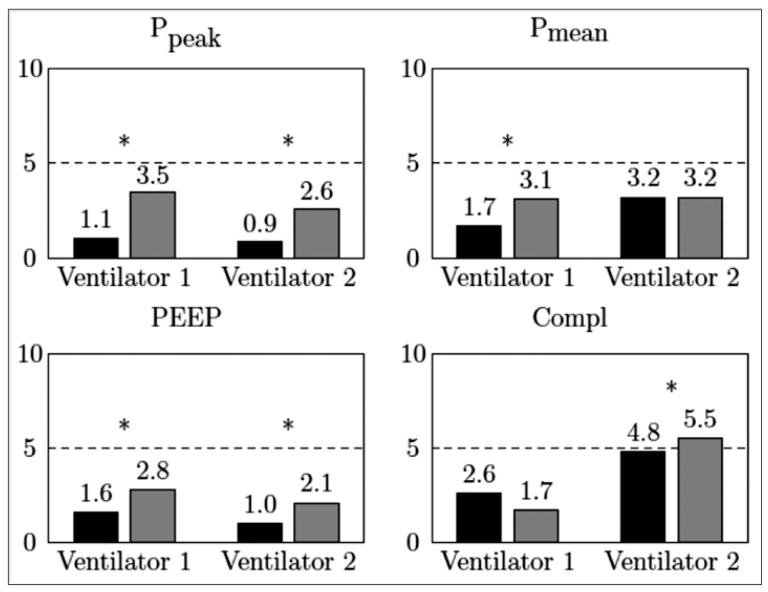
We studied the differences in pressure parameters obtained using ventilator spirometry and patient spirometry. An artificial lung was connected to a ventilator and a patient care monitor (GE HealthCare’s CARESCAPE Monitor B650) equipped with a spirometry module (GE HealthCare’s CARESCAPE respiratory module, E-sCAiOV.) D-lite and Pedi-lite sensors were used in the tests. Ventilator spirometry was obtained using two different ventilators.
A neonatal, pediatric, and an adult patient was simulated, using both pressure- and volume-controlled modes. Values obtained from the ventilators and from the respiratory module were compared against reference values obtained from the artificial lung.
We present results with data from both ventilation modes and all simulated patient groups pooled together. In Figure 3, the black bars correspond to patient spirometry errors and the grey bars to ventilator spirometry errors. An asterisk marks statistically significantly (p < 0.05) different comparisons.
Our results are in agreement with the theoretical considerations and support the view that using patient spirometry provides, in general, more accurate values than ventilator spirometry.
Discussion and Conclusions
From a theoretical point of view, patient spirometry is less prone to measurement errors that are caused by physical effects in the patient circuit. The closer to the lungs the measurement is made, the more accurate the obtained parameters reflect the situation in the lungs.
There are also published data suggesting that patient spirometry is more accurate than ventilator spirometry. A number of special circumstances exist when patient spirometry is the favored system, for example, using small tidal volumes and patients with increased respiratory system impedance.
Our tests concur with the theoretical considerations and the published data. Patient spirometry proved more accurate than ventilator spirometry in PEEP and peak pressure measurements. However, the test data was recorded in laboratory conditions and covered a wide range of simulated patients, making it hard to draw decisive conclusions based on them.
The D-lite flow sensor and gas sampler measures spirometry close to the patient airway and also allows simultaneous monitoring of CO₂, O₂, and anesthetic agents. In this measurement scheme, less error sources are present than in measurements made further away inside the ventilator.
References
- Jenu, Saana, Comparison between patient spirometry and ventilator spirometry. Master’s thesis. Aalto University. School of Electrical Engineering (2011).
- Meriläinen, P. et al. A novel sensor for routine continuous spirometry of intubated patients. J. Clin. Monit. 9, 374-380(1993).
- Nasiroglu, O. et al. Ventilator Y-piece pressure compared with intratracheal airway pressure in healthy intubated children. J. Clin. Monitor Comp. 20 95-100 (2006).
- Coté, CJ. et al. Wasted ventilation measured in vitro with eight anesthetic circuits with and without inline humidification. Anesthesiology 59(5), 443-446 (1983).
- Cannon, ML. et al. Tidal volumes for ventilated infants should be determined with a pneumotachometer placed at the endotracheal tube. Am. J. Respir. Crit. Care Med. 162(6), 2109-2112 (2000).
- Castle, RA. et al. Accuracy of displayed values of tidal volume in the pediatric intensive care unit. Crit. Care Med. 30(11), 2566-2574 (2002).
- Nève, V. et al. Influence of respiratory system impedance on volume and pressure delivered at the Y piece in ventilated patients. Pediatr. Crit. Med. 4(4), 418-425 (2003).
- S. I. Al-Majed, SI. et al. Effect of lung compliance and endotracheal tube leakage on measurement of tidal volume. Crit. Care 8(6), R398-R402 (2004).
- M. Heulitt, M. et al. Reliability of displayed tidal volume in infants and children during dual-controlled ventilation. Pediatr. Crit. Med. 10(6), 661-667 (2009).

