Clinical medical practice has used end-tidal CO2 measurement for several decades for purposes that include procedural sedation, adequacy of laryngeal intubation, pediatric critical care, and cardiopulmonary resuscitation. In contrast, there have been few use cases for monitoring end-tidal oxygen. Now research has identified emerging opportunities for further clinical research on the use of end-tidal oxygen measurement as an alternative to end-tidal CO2 and pulse oximetry. Researchers have found potential utility for end-tidal oxygen measurement in ventilation assessment, and in emergency department procedures including procedural sedation, assessment of ventilation/perfusion mismatch, pre-oxygenation during rapid sequence intubation, and prediction of central venous oxygen saturation.
Oxygen transport
Oxygen Utilization Basics
An exploration of the utility of respiratory gas measurement starts with an understanding of the basics of oxygenation and oxygen transport.
Oxygenation involves a series of steps that include inhalation, gas exchange, oxygen transport, oxygen delivery, oxygen extraction and exhalation. This paper provides an overview of the key steps along this path. Oxygen is central to the proper functioning of the human body, which functions optimally under aerobic conditions. The reason is that the conversion of glucose, the dominant fuel for cells, requires a high amount of oxygen to produce energy the body can utilize. This energy is more commonly referenced as adenosine triphosphate (ATP).
When oxygen is lacking (i.e. under anaerobic conditions), the metabolic processes become hampered, and alternative fuel sources are utilized to generate ATP. When tissue is exposed to anaerobic conditions for prolonged periods, tissue necrosis may ensue. For example, both stroke and myocardial infarction involve tissue necrosis as a direct result of tissue hypoxia resulting from obstructed blood flow.
The metabolic byproduct of tissue metabolism is carbon dioxide (CO2), which is transported from the tissue via blood circulation and is removed during exhalation. Abnormalities affecting carbon dioxide are assessed via measurements of partial pressures within the circulation (i.e. PCO2) or end-tidal measurements (i.e. etCO2) collected during exhalation. Changes to lung ventilation that become clinically significant are commonly identified through these measurement modalities. For instance, under respiratory distress, where ventilation is rapid and deep, the amount of CO2 cleared during exhalation increases, and this is reflected as low PCO2 and low etCO2. In contrast, when respiratory failure is imminent, ventilation decreases and is reflected by increasing PCO2 and etCO2 values.
Oxygen Uptake
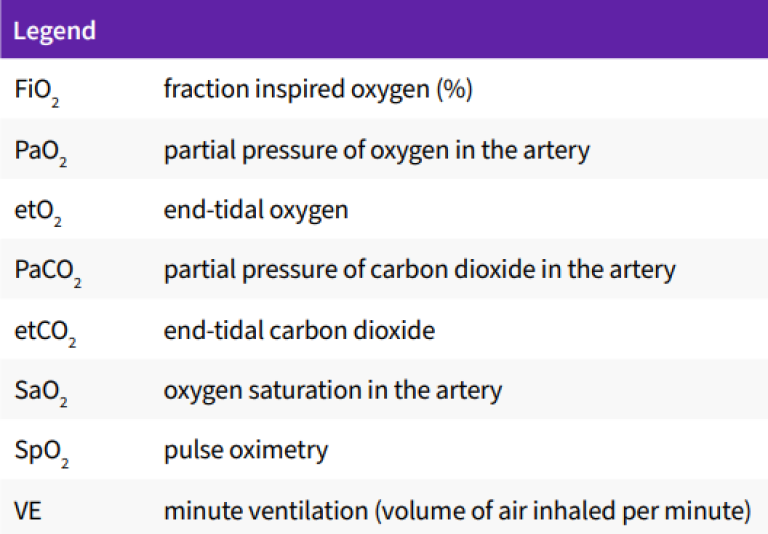
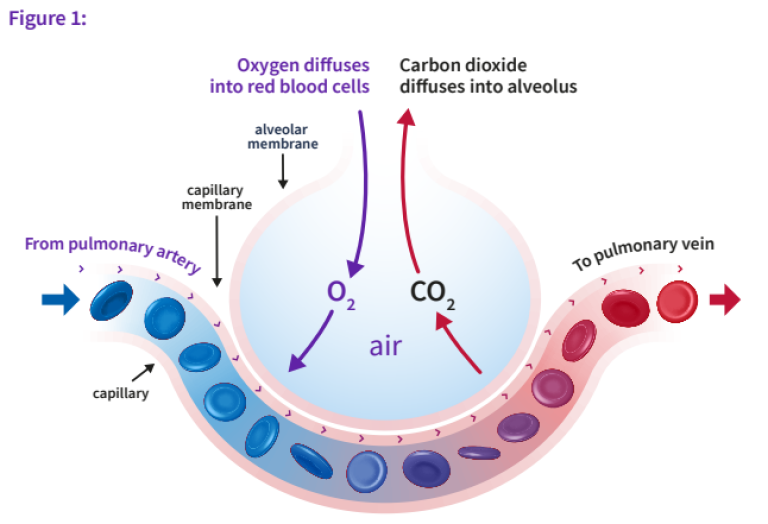
The air we breathe contains 21% oxygen and is commonly denoted as the fractional inspired oxygen concentration (FiO2). Under medical care, the minimal FiO2 that can be delivered is room air (FiO2=21%). But with supplemental oxygen, the FiO2 can be increased to 40% or higher with use of nasal prongs, a face mask, or forms of mechanical ventilation. In contrast, the atmospheric concentration of CO2 is negligible (FiCO2 = ~0%). As oxygen enters an alveolar unit during inhalation, mixed venous blood enters through capillaries that originate from the pulmonary artery. As the capillary blood traverses the alveolar unit, gas exchange occurs so that equilibration of gases occurs at the end-capillary portion of the alveolar unit.
Under normal gas exchange, the partial pressure of oxygen in the alveolus is greater than within the mixed venous circulation. For CO2, the opposite exists: the mixed venous partial pressure of CO2 is greater than within the alveoli. These diffusion gradients result in equilibration through the alveolar unit (Figure 1). The diffusion properties of CO2 are greater than those of oxygen; as a result the equilibration between the mix-venous capillary and alveolar compartments occurs sooner during transit of blood through the alveolar unit. As much CO2 is exchanged for a partial pressure difference of 5 mmHg between mixed venous and alveolar space as O2 is exchanged when the partial pressure difference is 60 mmHg.1 Therefore, within each alveolar unit, CO2 equilibrates sooner than O2. This is an important factor in understanding how changes in ventilation or perfusion can impact arterial or end-tidal gases.
When oxygen crosses from the alveolus into the mixed-venous capillary of the alveolar unit, that oxygen will bind to hemoglobin and be transported to the heart via the pulmonary vein. Once the oxygenated blood enters the heart, it is distributed to the tissue during each contraction of the ventricles. The oxygenated blood leaving the heart is carried predominantly bound to hemoglobin; a fraction is freely dissolved within the plasma. Abnormalities to cardiopulmonary function can impact gas exchange and result in perturbations in PaO2, PaCO2, etO2 and etCO2. Arterial hypoxemia can manifest, for example, as a result of hypoventilation.
In cases of hypoventilation, minute ventilation (VE) is reduced, impairing gas exchange at the alveolar unit. Mixed venous blood flow is not affected, while oxygen delivered into each alveolar unit is diminished; the ventilation/perfusion ratio is reduced compared to normal. What then manifests is a reduction in PaO2 and etO2 and an accumulation of carbon dioxide as reflected in an increased PaCO2 and etCO2. The oxygen gradient, which is the difference between the FiO2 and etO2 (e.g. FiO2 - etO2) is a newer concept that has been shown to correlate closely with changes in ventilation (described in more detail in a later section). The change in the oxygen gradient is the result of a static FiO2 in concert with ventilatory changes that impact etO2; hypoventilation will result in an increasing gradient while hyperventilation will see the gradient decrease. The partial pressure of oxygen and etO2 will increase, but the hallmark finding is a decrease in PaCO2 and etCO2.
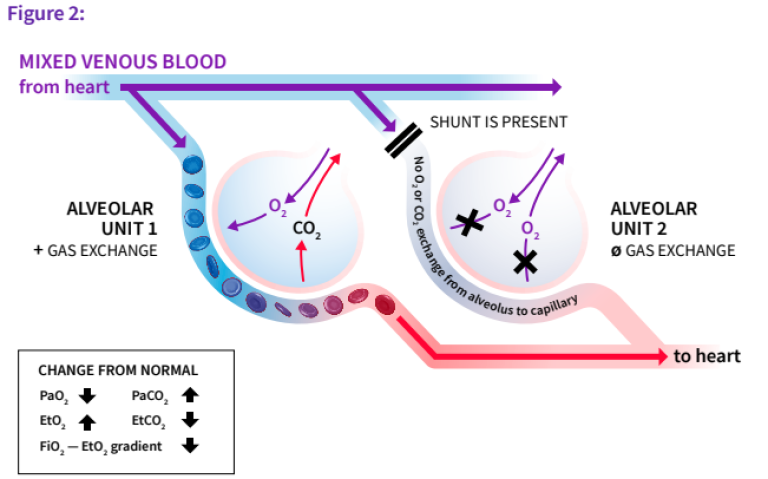
In the presence of a perfusion shunt (Figure 2), ventilation to the alveolar unit is unaffected, but the number of mixed-venous capillaries participating in gas exchange (i.e. alveolar units not receiving mixed-venous blood) is decreased. This results in unique changes to the gas-exchange relationship. Notably, the alveolar units affected by a perfusion shunt make no contribution to gas exchange, and the mixed-venous and end-capillary O2 and CO2 will be the same. Given that the lung is comprised of many alveolar units, the degree of shunt will affect PaO2 levels (decrease) and PaCO2 levels (increase). The magnitude of changes to O2 and CO2 depends on the size (or relative percentage) of alveolar units affected.
The percentage of oxygen bound to hemoglobin corresponds to the degree of oxygen saturation (SaO2) within the artery. The oxygen saturation dissociation curve (Graph 1) illustrates the degree of oxygen saturation for each step change in the partial pressure of oxygen (PaO2). The curve is sigmoid in shape with the steepest portion in the middle of the curve. The significance of this is that minor changes in PaO2 impart different changes to SaO2 depending on the position along the curve. When oxygen saturation is above 92%, changes in PaO2 are difficult to recognize without invasive testing such as blood gas analysis, given the flat nature of the dissociation curve.
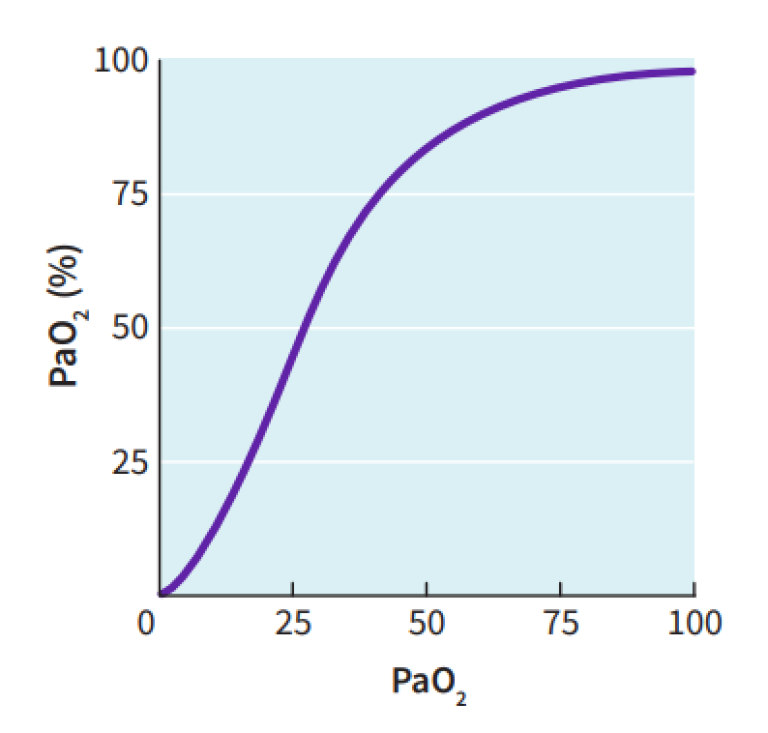
Oxygen saturation is depicted as SaO2 and can range from 0-100%; normal saturation is 92% or greater. Conventional patient monitors measure peripheral oxygen saturation (SpO2) and are frequently used interchangeably. Mixed venous oxygen saturation follows the same oxygen dissociation principles and is depicted as SvO2.
Oxygen Delivery
The delivery of oxygen (DO2) to the tissue is the product of oxygen content (CaO2) of the blood and cardiac output (CO). The delivery of oxygen to the tissue is derived from the following equation(s):
- CO = HR x SV (HR = heart rate, SV = stroke volume)
- CaO2 = SaO2 x Hb x 1.34 + PaO2 x 0.003 (Hb = hemoglobin)
- DO2 = CaO2 x CO
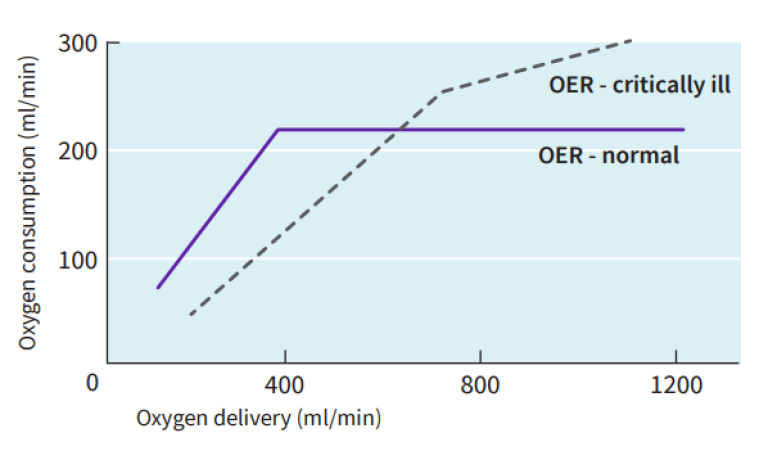
Once blood is transported to the tissues, oxygen is extracted from hemoglobin in a ratio corresponding to oxygen consumption (VO2); under aerobic conditions the normal extraction ratio is 25%. The oxygen extraction ratio (OER) can be represented as a relationship between oxygen delivery and oxygen consumption (Graph 2).
- OER = VO2/DO2 = (SaO2 -SvO2) /SaO2
As oxygen consumption increases or oxygen delivery falls, the OER will rise in order to maintain aerobic metabolism. At the threshold where oxygen delivery can no longer fulfill oxygen consumption, anaerobic metabolism develops and there is an accumulation of oxygen debt. Oxygen debt commences when the maximum OER is attained (e.g. between 60-70%). As blood returns to the heart for re-oxygenation, the mixed venous (or central venous) oxygen saturation can be measured invasively. This measure can provide an inference to the balance between oxygen delivery and oxygen consumption.
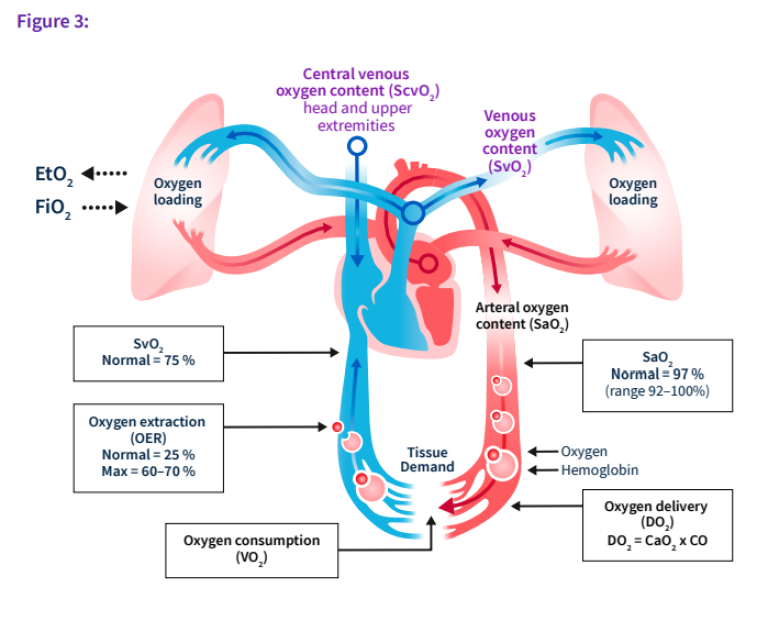
To summarize, there exists a balance between oxygen intake, oxygen delivery and oxygen consumption. The figure below (Figure 3) provides a visual representation of this balance. The expiratory phase of the oxygen transport process affords the opportunity to measure end-tidal gases. Clinical practice has used end-tidal CO2 for several decades. Indications for use include but are not limited to procedural sedation,2 adequacy of laryngeal intubation,3 pediatric critical care4 and cardiopulmonary resuscitation.5 In contrast, there has been a paucity of use cases for monitoring end-tidal oxygen. The subsequent sections aim to illustrate emerging opportunities for further clinical research for use of end-tidal oxygen measurements.
Emerging topics on end-tidal oxygen measurement
Recent research has explored the utility of end-tidal oxygen measurement in a variety of clinical scenarios. Here are several applications for which end-tidal oxygen measurement has shown potential for clinical benefit.
Ventilation Assessment
Historically, the core measures associated with monitoring respiratory function included pulse oximetry (SpO2) and end-tidal CO2 (etCO2). Both are available noninvasively and provide minute-by-minute data streams that can inform the clinician of potentially serious perturbations in respiratory status. It has been established that end-tidal CO2 can serve as an estimate for PaCO2 and thus inform clinicians on the ventilation and CO2 elimination status of a patient.6 However, changes in end-tidal CO2 incorporate the impact of buffering of CO2 within the blood and reflect a delayed view of ventilatory changes.7, 8 In the future, breath-by-breath analysis of oxygen concentration may support enhanced ventilatory status monitoring.
A study by Linko et al. aimed to evaluate relationships that may exist between end-tidal oxygen and arterial gas measurements during periods of hypoventilation.8 The authors conducted a large animal study in pigs during a series of planned hypoventilation conditions. Minute ventilation was decreased by 50% and 75% from the baseline in order to measure the utility of etO2 through these changes in minute ventilation. In addition, FiO2 was changed through five step increments (20%, 40%, 60%, 80% and 100%).
The researchers observed an association between etO2 and PaO2 when the FiO2 was 40% or less. As hypoventilation worsened, both etO2 and PaO2 decreased, and the relationship was more robust when the FiO2 approximated room air. The authors introduced a gradient measure between FiO2 and etO2, from here on termed as the oxygen gradient. When ventilation was reduced by 50%, the PaO2 fell by 23% and the FiO2 – etO2 (oxygen gradient) increased 112%, but no change in SpO2 was observed. This further supports the hypothesis that SpO2 as measured by pulse oximetry is an insensitive indicator of hypoventilation. The authors concluded that FiO2 – etO2 is the most sensitive parameter for detection of hypoventilation. Furthermore, increases in the FiO2 – etO2 gradient indicated an imbalance between oxygen delivery (DO2) and oxygen consumption (VO2), and changes in FiO2 – etO2 predicted the onset of hypoxemia earlier than SpO2.
Building off of these animal results, the same authors conducted a human study during general anesthesia.9 In this clinical study (n=20 patients), they performed breath-by-breath recording of oxygen, carbon dioxide and oxygen saturation during general anesthesia and immediately during recovery. During periods of apnea, the decreasing alveolar oxygen was detected earlier by the oxygram (etO2) than by SpO2. During hypoventilation, the end-tidal O2 changes were identified more rapidly than changes in etCO2. More important, the FiO2-etO2 gradient served as a more sensitive index of hypoventilation than either end-tidal CO2 or pulse oximetry.
Changes in the oxygram and specifically the oxygen gradient during periods of hyperventilation have also shown promise. A study was conducted in spontaneously breathing healthy volunteers (n=10) using a T-piece system designed to attain non-rebreathing conditions.10 Inspiratory oxygen (FiO2) and carbon dioxide (FiCO2) were measured along with expired oxygen (etO2) and carbon dioxide (etCO2) fractions and oxygen saturation (SpO2). Each of the volunteers underwent a standardized sequence of ventilation (minute ventilation, VE) changes based on resting respiratory status. The first step of hyperventilation was to double VE from the baseline; five minutes thereafter the VE was tripled and held for five minutes. A simulated hypoventilation occurred thereafter - the patients were instructed to return to resting ventilation for another five minutes. This aimed to reflect a relative hypoventilation condition. There was no change to the FiO2 during this sequence of ventilation interventions.
The oxygen gradient (FiO2-etO2) was tracked during each change in ventilation VE. The minute ventilation changed from 3.3 liters m-2 min-1 at rest, to 6.4 at 5 minutes (p<0.01), 8.4 at 10 minutes (p<0.01) and 2.5 (p<0.01) at 15 minutes. This latter measure reflected the relative hypoventilation state when compared to the 10-minute mark of 3x VE.
In summary, there is limited evidence to suggest that end-tidal oxygen measurement has clinical utility in the assessment of hypoventilation that trumps the use of pulse oximetry. The utility of etO2 monitoring is optimal when the FiO2 is between 21-40%. The use of supplemental oxygen beyond 40% does not provide clinically meaningful information because the sensitivity of the FiO2 – etO2 relationship degrades. In the study, the oxygen gradient (FiO2-etO2) changed from a baseline value of 48 mm Hg to 29 mm Hg at 5 min and 22 mm Hg at 10 min (all p<0.01)*. During the period of relative hypoventilation, the oxygen gradient increased to 62 mm Hg (p<0.05). End-tidal CO2 changes during the experiment showed a resting value of 45 mm Hg, decreasing to 34 mm Hg at 5 minutes, 27 mm Hg at 10 minutes, and increasing to 40 mm Hg at 15 minutes (all p<0.01). Pulse oximetry showed modest changes of 96.3%, 97.2%, 97.6% and 92.9% at rest and at 5, 10 and 15 minutes, respectively.
In this study, the oxygen gradient (FiO2-etO2) showed an inverse relationship to VE, and for a 50% decrease in VE the oxygen gradient increased by 50%. The changes in oxygen gradient were more rapid than changes in end-tidal CO2. In addition, the relative change in oxygen gradient was larger than that of etCO2. In contrast, oxygen saturation showed modest changes during the sequence of hyperventilation steps. Therefore, the authors concluded that the oxygen gradient (FiO2-etO2) could provide earlier indications of changes to ventilation than conventional measurements of etCO2 and SpO2, especially when FiO2 was ≤40%. Extrapolation to the use of the FiO2-etO2 gradient in spontaneous weaning trials appears to be a logical avenue for future exploration. The gradient has shown the ability to correlate with changes in minute ventilation, and it changes more quickly than changes in either etCO2 or SpO2. Use of the oxygen gradient may provide clinicians with an added layer of detail that can better indicate when patients are suitable for weaning.
* Data was originally presented in kPa but was converted to mm Hg using publicly available conversion calculators https://www.checkyourmath.com/convert/pressure/kilopascals_mmhg.php
ED applications of the capnograph and oxygraph
Procedural Sedation
Procedural sedation involves the use of intravenous agents used to induce a level of sedation and analgesia in order to facilitate painful procedures. In the emergency department (ED), representative procedures would include laceration repair, fracture reduction, incision and drainage, and cardioversion. Adverse events are known to occur and, while rare, some can be serious, such as apnea, bradycardia, hypotension and aspiration. Advances in procedural sedation have evolved from use exclusively within the operating theater to use more broadly within the hospital setting, including the ED.
Cardiopulmonary complications that occur during procedural sedation are often related to respiratory depression that cascades into hypoxia and cardiac decompensation. Respiratory depression can occur in up to 44% of ED cases undergoing procedural sedation.2 Standard monitoring has included continuous pulse oximetry and cardiac monitoring throughout the procedure to provide a layer of patient safety. More recently, the use of end-tidal CO2 capnography has grown in adoption to further augment patient safety. End-tidal capnography has the benefit of recognizing respiratory depression earlier than pulse oximetry and has been found to be more sensitive than clinical evaluation. In fact, compromised respiratory function was detected 5 to 240 seconds earlier with continuous etCO2 monitoring when compared to changes in pulse oximetry.11, 12
The premise of end-tidal capnography relies on the understanding of the ventilation and gas exchange principles that were described earlier. When intravenous agents that induce sedation or analgesia result in respiratory depression, changes in ventilation (decreased VE) will result in a decreased release of carbon dioxide during exhalation. Over time, systemic carbon dioxide will accumulate and result in an upward deflection in the CO2 capnograph. When increases in CO2 are observed, the clinician can be alerted to reassess the patient’s airway and breathing status in order to prevent desaturation or more serious complications.
In a meta-analysis, end-tidal capnography demonstrated a significant reduction in the incidence of mild desaturation (relative risk = 0.77, 95% CI = 0.67-0.89).13 The odds of severe desaturation (SpO2 ≤85%) were also significantly reduced (RR = 0.59, 95% CI = 0.38-0.78). Assisted ventilation, which requires the use of a bag-valve mask, was shown to be favorably impacted by using etCO2 monitoring; the odds ratio was significantly lower at 0.47 (95% CI = 0.23-0.95) when compared to SpO2. On the whole, this meta-analysis supported the conclusion that use of end-tidal CO2 capnography during procedure sedation can improve patient safety via reductions in mild desaturation, severe desaturation and assisted ventilation rates.
Building from there is the potential application of the oxygen gradient (FiO2-etO2), which shows a strong correlation to changes in minute ventilation as described earlier. Furthermore, the oxygen gradient has been reported to change more rapidly than etCO2 and SpO2 in response to hypoventilation. Could this measure add an incremental layer of patient safety to a procedure known to have the risk for respiratory complications?
Ventilation/Perfusion Mismatch
Efficient gas exchange at the alveoli is dependent upon matching alveolar ventilation (V) and perfusion (Q). An imbalance between these two can result from impaired ventilation or reduced perfusion and is termed a ventilation-perfusion (V/Q) mismatch. This mismatch results in suboptimal oxygenation of blood in the pulmonary artery and in turn negatively affects oxygen delivery (DO2). As stated earlier, impairment in DO2 can progress into anaerobic metabolism and organ damage. The hallmark condition associated with a V/Q mismatch is a pulmonary embolism, which results in a subtotal obstruction within the pulmonary arterial circulation and can be fatal depending on the degree of obstruction.
Pulmonary embolism is a medical condition that commonly presents with a combination of chest pain, shortness of breath and hypoxemia.14 The clinical presentation can be diverse, and many diagnostic and imaging modalities have been deployed with the aim to improve the diagnostic accuracy. Diagnostic algorithms have been introduced in order to enhance the diagnostic precision of pulmonary embolism through the combination of clinical presentation, laboratory tests and diagnostic imaging modalities.15 Paoletti et al. illustrated that end-tidal CO2 was significantly lower while end-tidal O2 was significantly higher in patients with pulmonary embolism compared to normal patients, or patients with chronic obstructive lung disease.16 This led to the hypothesis that end-tidal CO2/O2 ratio will be lower in patients with pulmonary embolism.
Kline et al. conducted a study to assess the clinical utility of end-tidal PCO2 and PO2 as noninvasive diagnostic tools in the assessment of patients with suspected pulmonary embolism (PE).17 Furthermore, they assessed deep exhalation or 30-second averaged end-tidal measurements obtained during normal tidal breathing. The PO2, PCO2 and PCO2/PO2 ratio remained stable during repeated measures across both breathing techniques. There was clear separation in PCO2/PO2 ratio between PE-positive patients compared to PE-negatives; that was observed with both deep exhalation and 30-second averaged tidal breathing measurements. Furthermore, receiver operating characteristic curves were plotted and were robust for both end-tidal breath assessments. The area under the curve (AUC) for deep exhalation was 0.728 compared to 0.803 for 30-second tidal breathing. The PCO2/PO2 cutoff that yielded a sensitivity of 95% was 0.40. Lastly, the authors combined pre-test probability with the PCO2/PO2 cutoff and concluded that this approach could provide a definite rule-in for 67.4% of patients.
This single-center study builds off of previous evidence that suggests end-tidal measurements of both oxygen and carbon dioxide can serve as an effective screening tool for suspected pulmonary embolism. This solution would be noninvasive, simple and rapid to obtain. A multi-center study conducting similar assessments would add weight to the potential clinical utility of this diagnostic approach.
Preoxygenation During Rapid Sequence Intubation
Another intervention central to emergency medicine practice is rapid sequence induction (RSI) and intubation to place a patient on mechanical ventilation. The first step of RSI is to preoxygenate the patient. This involves the removal of nitrogen stored within the body (denitrogenization) and replacement with oxygen. The basis for denitrogenization is to create a reservoir of oxygen within the pulmonary system that prevents hypoxia during the apneic phase of intubation. Common practice in the ED is to measure continuous SpO2 during RSI; use of gas analyzers remains uncommon. Present-day gas analyzers can measure etCO2 and etO2 levels in real time to provide clinicians with another layer of data that informs respiratory function.
The premise of using etO2 was first used in the operating theater for optimizing preoxygenation.18, 19 Guidelines recommend that critically ill patients undergoing RSI be preoxygenated until the etO2 level reaches ≥ 85%.20 A study by Caputo et al. was the first conducted in the ED addressing etO2 measurements in patients undergoing RSI.21 In this two-center prospective study in patients requiring RSI, a total of 100 patients were enrolled. At the initiation of preoxygenation, the median etO2 was 53%, and at the induction phase the etO2 was 78%; there was no difference between use of a nonrebreather mask compared to bag-valve-mask ventilation. Only 25% (n=26) of the patients achieved a target etO2 level of 85%, while 36% achieved levels between 70-85% and 27% attained levels of 50-69%. In addition, 11% did not achieve an etO2 level > 50%. Desaturation below 90% occurred in 18% of patients and marked desaturation (<80%) occurred in 2% of the cases. Among the cases that experienced desaturation, only 11% had an etO2 >85% at the time of induction. These authors concluded that measurement of etO2 in the ED may be a valuable adjunct to optimize preoxygenation during emergency airway management requiring RSI.
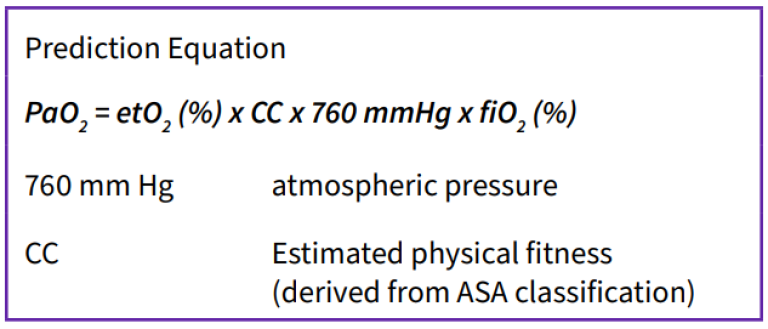
Another study conducted in the ED assessed the reliability of end-tidal oxygen measurement to predict arterial oxygen (PaO2) during RSI.22 The authors specifically examined the relationship between FiO2 and etO2 at the time of induction to predict PaO2. In this single-center prospective study, 75 patients were enrolled who required RSI for emergency airway support. Preoxygenation was controlled with a mean time of 12.5 minutes and a mean apnea time of 59 seconds. The predicted and actual PaO2 were recorded within 3 minutes of intubation; the predicted PaO2 was derived from an equation using FiO2 and etO2 values. The Pearson correlation coefficient was strong: r=0.89 (95% CI 85-92%) and the Bland-Altman plots suggested no substantial bias affecting correlation. The authors summarized that use of a gas analyzer to measure FiO2 and etO2 can provide a reliable measure of the minimum PaO2 during RSI. Future research should explore other uses of end-tidal oximetry, this PaO2 prediction equation, and other relationships to further optimize patient respiratory function.
Prediction of Central Venous Oxygen Saturation
Mixed venous oxygen saturation (SvO2) is used commonly within the intensive care unit (ICU) and for high risk surgery (i.e. liver transplant or cardiothoracic surgery). The central venous oxygen saturation (ScvO2) is commonly used in the acute care setting (ED, ICU) as a surrogate for SvO2 because it is less invasive. The SvO2 requires placement of a highly invasive pulmonary artery catheter within the pulmonary artery while ScvO2 needs the placement of a central venous catheter within the right atrium. In both the central and mixed venous saturation, the measure is used as a surrogate for cardiac output and thus oxygen delivery (DO2). Understanding oxygen delivery is critical when managing a patient with sepsis or other serious illnesses that can compromise the balance between oxygen delivery and oxygen consumption. In shock states like sepsis, the patient’s DO2 may be imbalanced compared to oxygen consumption (VO2), and that can contribute to oxygen debt that manifests as an elevation in serum lactate. A noninvasive surrogate marker for ScvO2 would be desired, especially in the ED where the majority of sepsis cases first present.
The premise behind this is the understanding of the oxygen-hemoglobin disassociation curve, where the percentage of red blood cells bound to oxygen varies with the partial pressure of oxygen in the plasma and follows a sigmoidal curve. Equilibration of the partial pressure of oxygen between the alveolus and pulmonary mixed venous capillaries (alveolar unit) occurs rapidly throughout the respiratory cycle. Therefore, one can surmise that the partial pressure of oxygen in the central blood would correlate directly with the nadir partial pressure of oxygen in a deep expired breath. This could serve as a noninvasive means to estimate ScvO2.
A study conducted by Singer et al. aimed to assess the agreement between end-tidal oxygenation and ScvO2 in critically ill patients managed in an ED setting with a central venous catheter in place.23 This study enrolled 27 patients in a prospective observational study where etO2 was measured at the time blood was drawn from a central venous line for the purpose of measuring ScvO2. Modest agreement was observed via Bland-Altman plots demonstrated with bias towards etO2 under-representing ScvO2.
Leveraging the potential association between etO2 and ScvO2, a separate study was conducted by Jones et al.24 in a convenience sample of patients with end-stage renal disease undergoing elective hemodialysis managed through a pre-existing central venous catheter. A side-stream analyzer was used to measure etO2 and etCO2 immediately after central venous blood was drawn for ScvO2 analysis. Patients were instructed to perform repeated deep exhalation breathing in order to obtain an average etO2 measure. In total, 21 patients were prospectively enrolled, and no significant correlation between etO2 and ScvO2 was identified. A linear equation incorporating etO2 and ScvO2 had modest predictive accuracy. Despite the lackluster findings, one limitation deserves attention. This study used a side-stream measurement technology that could have resulted in inaccurate measurements and deep expiratory breathing may not be representative of the ScvO2. In addition, a methodological design that considers the use of tidal breathing over 30 seconds to measure the average nadir etO2 could be more predictive.
Clinicians for years have explored noninvasive means to evaluate patients with or at-risk of critical illness, and these include end-tidal oxygen measurements. While no strong association has been identified between etO2 and ScvO2 at this time, future research to examine alternate measurement techniques and waveform analysis leveraging etO2 may provide additional details on clinical utility for this application.
References
- Petersson, J. and R.W. Glenny, Gas exchange and ventilation-perfusion relationships in the lung. Eur Respir J, 2014. 44(4): p. 1023-41.
- Miner, J.R., W. Heegaard, and D. Plummer, End-tidal carbon dioxide monitoring during procedural sedation. Acad Emerg Med, 2002. 9(4): p. 275-80.
- Silvestri, S., et al., The effectiveness of out-of-hospital use of continuous end-tidal carbon dioxide monitoring on the rate of unrecognized misplaced intubation within a regional emergency medical services system. Annals of emergency medicine, 2005. 45(5): p. 497-503.
- Bhende, M., End-tidal carbon dioxide monitoring in pediatrics-clinical applications. Journal of postgraduate medicine, 2001. 47(3): p. 215.
- Garnett, A.R., et al., End-tidal carbon dioxide monitoring during cardiopulmonary resuscitation. Jama, 1987. 257(4): p. 512-515.
- Nunn, J., Applied respiratory physiology 2nd edn. London, Butter-worths, 1977: p. 460.
- Zar, H.A., et al., Monitoring pulmonary function with superimposed pulmonary gas exchange curves from standard analyzers. J Clin Monit Comput, 2002. 17(3-4): p. 241-7.
- Linko, K. and M. Paloheimo, Inspiratory end-tidal oxygen content difference: a sensitive indicator of hypoventilation. Crit Care Med, 1989. 17(4): p. 345-8.
- Linko, K. and M. Paloheimo, Monitoring of the inspired and end-tidal oxygen, carbon dioxide, and nitrous oxide concentrations: clinical applications during anesthesia and recovery. J Clin Monit, 1989. 5(3): p. 149-56.
- Bengtsson, J., et al., Effects of hyperventilation on the inspiratory to end-tidal oxygen difference. Br J Anaesth, 1994. 73(2): p. 140-4.
- Burton, J.H., et al., Does end-tidal carbon dioxide monitoring detect respiratory events prior to current sedation monitoring practices? Acad Emerg Med, 2006. 13(5): p. 500-4.
- Deitch, K., et al., Does end tidal CO2 monitoring during emergency department procedural sedation and analgesia with propofol decrease the incidence of hypoxic events? A randomized, controlled trial. Ann Emerg Med, 2010. 55(3): p. 258-64.
- Saunders, R., et al., Patient safety during procedural sedation using capnography monitoring: a systematic review and meta-analysis. BMJ Open, 2017. 7(6): p. e013402.
- Tapson, V.F., Acute pulmonary embolism. N Engl J Med, 2008. 358(10): p. 1037-52.
- Hemnes, A.R., et al., Bedside end-tidal CO2 tension as a screening tool to exclude pulmonary embolism. Eur Respir J, 2010. 35(4): p. 735-41.
- Paoletti, P., et al., The assessment of gas exchange by automated analysis of O2 and CO2 alveolar to arterial differences. Int J Clin Monit Comput, 1986. 3(2): p. 89-97.
- Kline, J.A. and M. Hogg, Measurement of expired carbon dioxide, oxygen and volume in conjunction with pretest probability estimation as a method to diagnose and exclude pulmonary venous thromboembolism. Clin Physiol Funct Imaging, 2006. 26(4): p. 212-9.
- Pourmand, A., et al., Pre-oxygenation: Implications in emergency airway management. Am J Emerg Med, 2017. 35(8): p. 1177-1183.
- Benumof, J.L., Preoxygenation: best method for both efficacy and efficiency. Anesthesiology, 1999. 91(3): p. 603-5.
- Higgs, A., et al., Guidelines for the management of tracheal intubation in critically ill adults. Br J Anaesth, 2018. 120(2): p. 323-352.
- Caputo, N.D., et al., Use of End Tidal Oxygen Monitoring to Assess Preoxygenation During Rapid Sequence Intubation in the Emergency Department. Ann Emerg Med, 2019. 74(3): p. 410-415.
- Murphy, S., et al., Novel Use of a Gas Analyzer Can Reliably Predict the Arterial Oxygen among Emergency Department Patients Undergoing Rapid Sequence Intubation. The Journal of Emergency Medicine, 2020.
- Singer, D., J. Russell, and N. Caputo, 351 End Tidal Oxygen: A Non-Invasive Measurement of Cardiac Output. Annals of Emergency Medicine, 2019. 74(4): p. S138.
- Jones, A. E., et al. (2006). “End expiratory oxygen concentrations to predict central venous oxygen saturation: an observational pilot study.” BMC emergency medicine 6(1): 9.

Dr. Robert N. Bilkovski, MD, MBA
President, RNB Ventures Consulting Inc.
Dr. Bilkovski has broad management experience, having served in leadership roles in multiple Fortune 500 companies overseeing medical affairs and clinical development in IVD, medical device, and pharmaceuticals industries. Some of the companies where he served in leadership roles include Hospira, GE HealthCare, Abbott Laboratories, and Becton Dickinson. Robert currently is the President of RNB Ventures Consulting Inc. providing strategic consulting in the field of medical and clinical affairs for medical device and diagnostic companies.
Dr. Bilkovski received his undergraduate degree in biochemistry with a focus in genetic engineering at McMaster University in Hamilton, Ontario, Canada. Robert completed his medical training at Rosalind Franklin University/The Chicago Medical School and subsequently pursued specialization in emergency medicine. Lastly, Dr. Bilkovski earned his MBA at the University of Notre Dame as part of his transition from clinical medicine to medical industry.

