What is Patient Spirometry?
Patient Spirometry measures airway pressures, flow, volumes, compliance and airway resistance breath-by-breath at the patient’s airway. The dynamic interrelationships of pressure and volume or flow and volume are displayed as graphical loops.
In addition the inspired and expired gas concentrations are measured (CO₂, O2 and anesthetic agents).
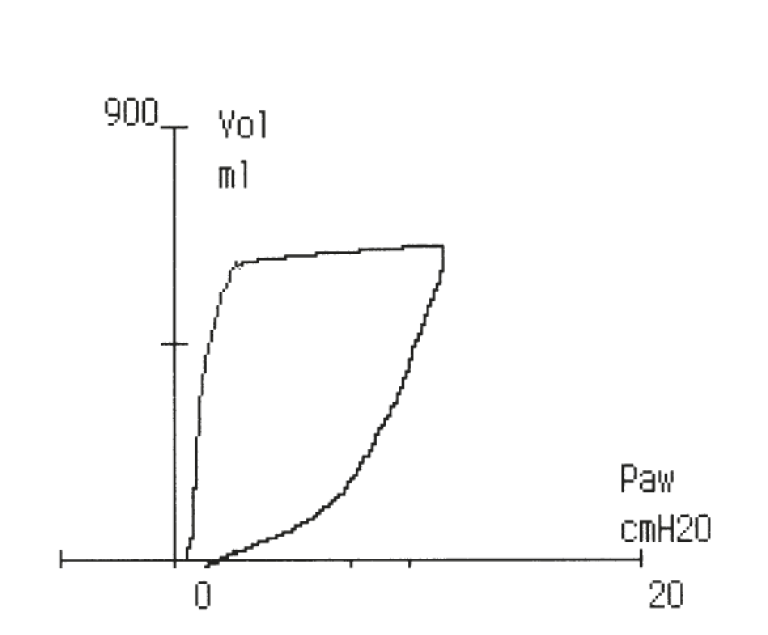
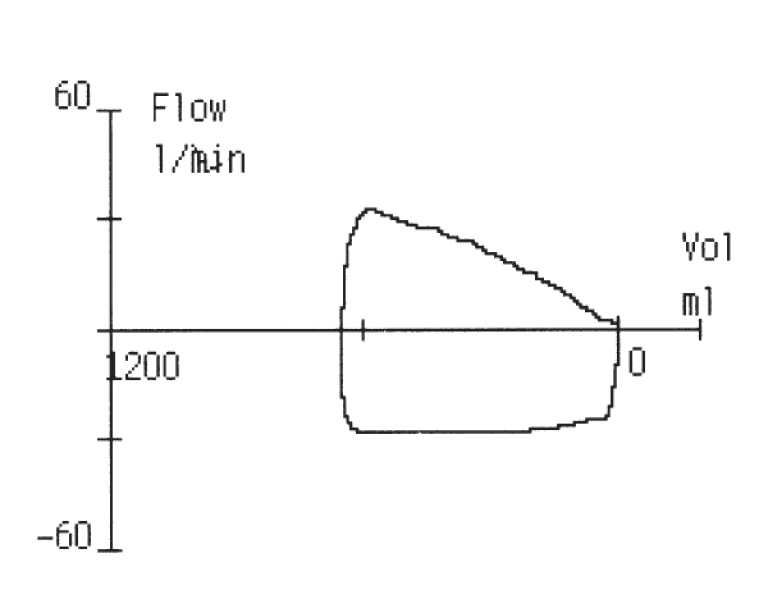
All parameters are measured through a single, lightweight flow sensor and gas sampler, placed at the patient’s airway. The “close to the patient” measurement is a sensitive and continuous reflector of patient’s ventilatory status, obtained independently of the ventilator used.
How is Patient Spirometry measured?
D-lite™ is an innovative, patented pressure and flow sensor.
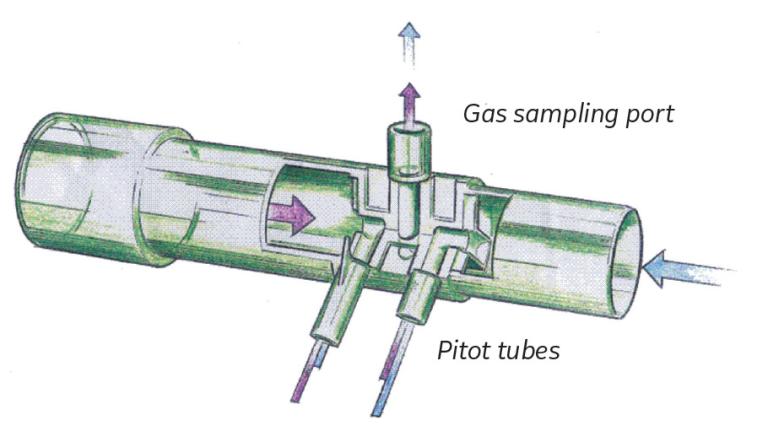
Its two pitot tubes measure the pressure difference created by the gas flow. This pressure difference is used together with gas concentration information to calculate the flow. From the flow, both inspiratory and expiratory volumes are calculated.
Total positive end expiratory pressure (PEEPtot) is the sum of externally applied PEEP (extrinsic PEEP, PEEPe) and intrinsic PEEP (PEEPi).
PEEPtot= PEEPi + PEEPe
Dynamic PEEPi is detected when the expiratory flow has not stopped before the next inspiration starts. Presence of PEEPi indicates the air trapping situation in the lung, which may lead
both in respiratory and hemodynamic side effects.
Compliance reflects the distensibility of the respiratory system. It is defined as a pressure difference required to expand the lung by a certain volume.
Compl = TVexp/(Pplat-PEEPtot)
As a continuous dynamic value it provides an easy tool for the clinician to follow respiratory changes and to adjust ventilator settings accordingly.
Airway resistance (Raw) is calculated by using an equation, which gives an average system resistance between the lungs and the D-lite sensor over the total breathing cycle.
Paw(t) = Raw x V(t) + V(t)/Compl + PEEPtot
Clinical examples of Patient Spirometry
Leak in the airway
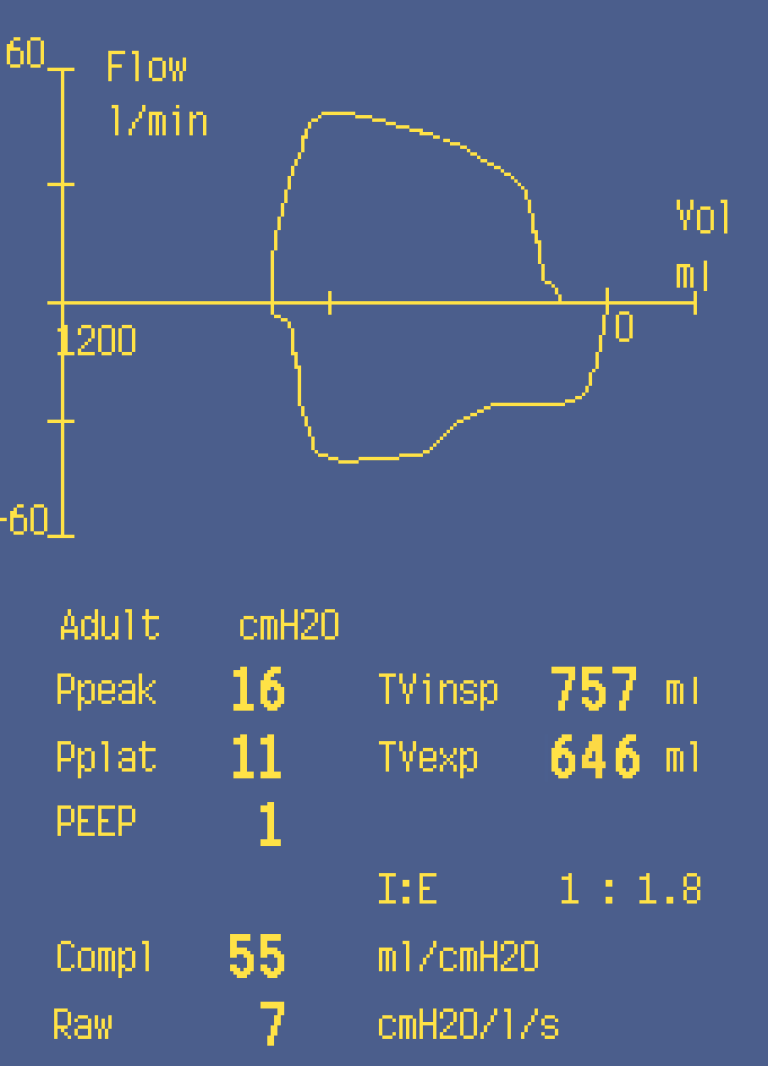
Leak in the airway is indicated by a loop remaining open at the end of expiration.
Leak in breathing system, in endotracheal tube or laryngeal mask, or even in the patient’s lung may remain unnoticed without loop monitoring.
Obstruction in the airway
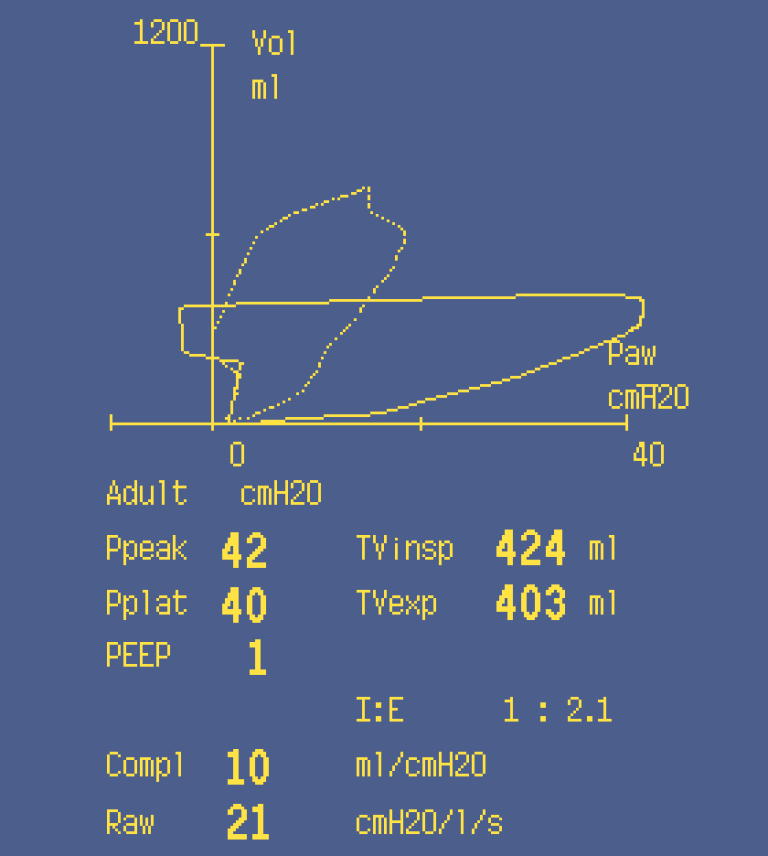
A loop moving towards the horizontal axis indicates airway obstruction that increases airway pressure without corresponding increase in tidal volume.
An obstruction caused by a kinked tube, airway secretion or malposition of endotracheal tube can be immediately detected.
In Anesthesia
Monitoring of changes during laparoscopy
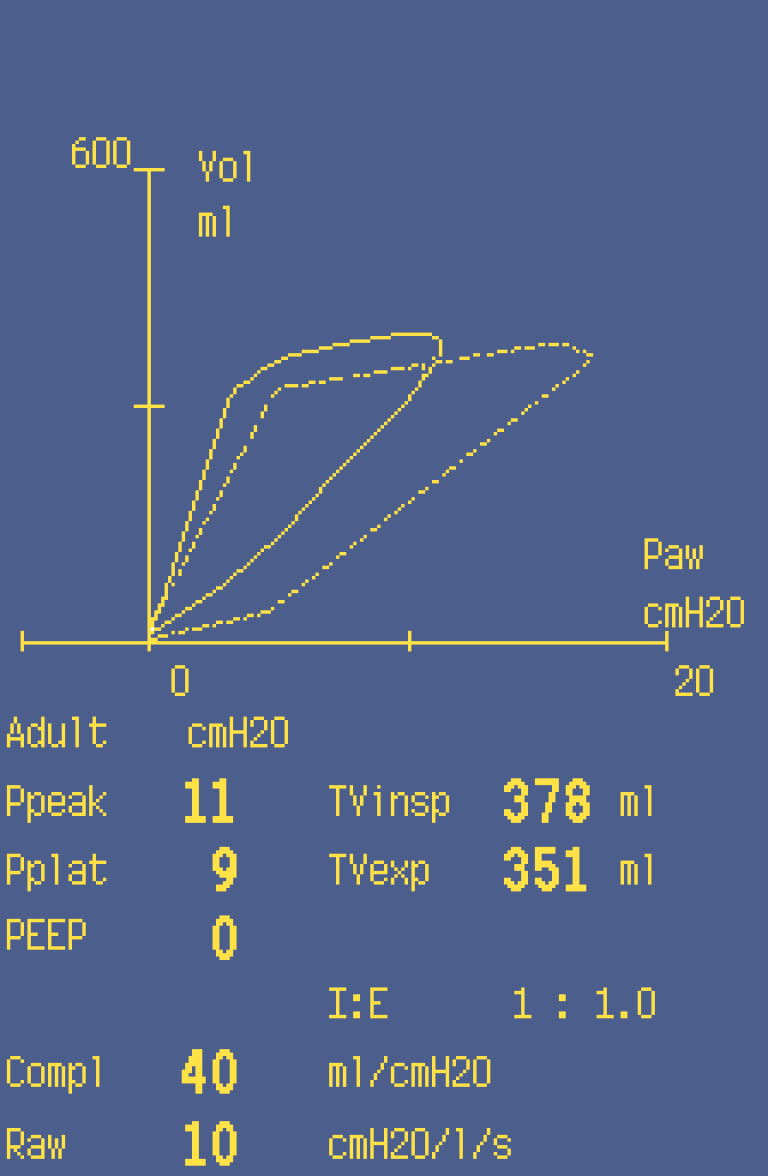
This figure illustrates the patient’s ventilatory pattern before (1) and during CO2 insuflation (2) in the laparoscopic operation.
A decrease in compliance and increase in airway pressure are clearly visible.
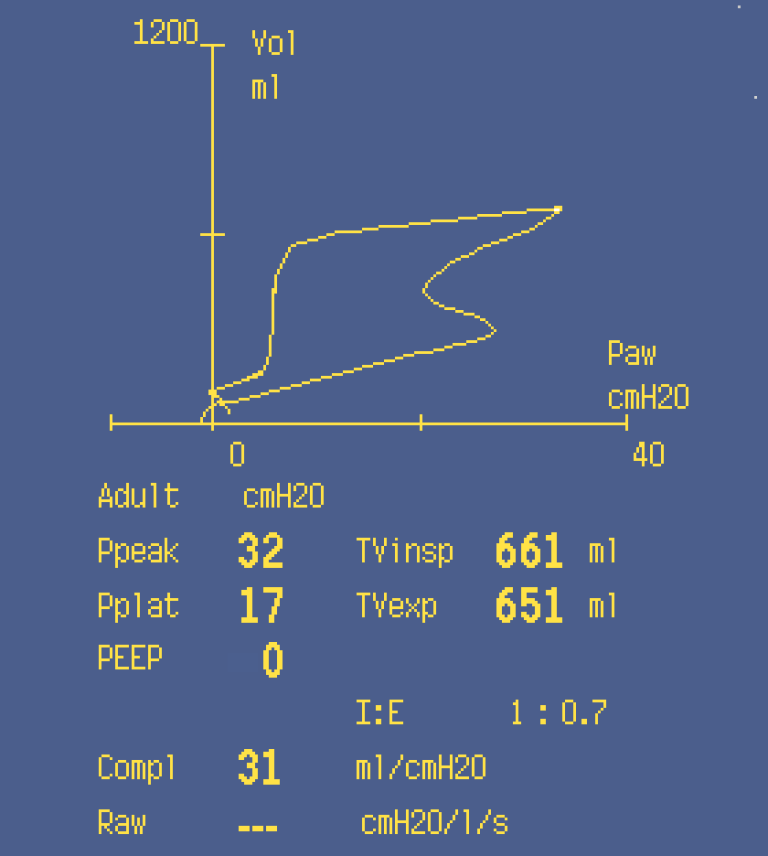
Spontaneous breathing efforts
This loop illustrates an initiation of a spontaneous breath during anesthesia.
In Critical Care
Intrinsic PEEP (autoPEEP)
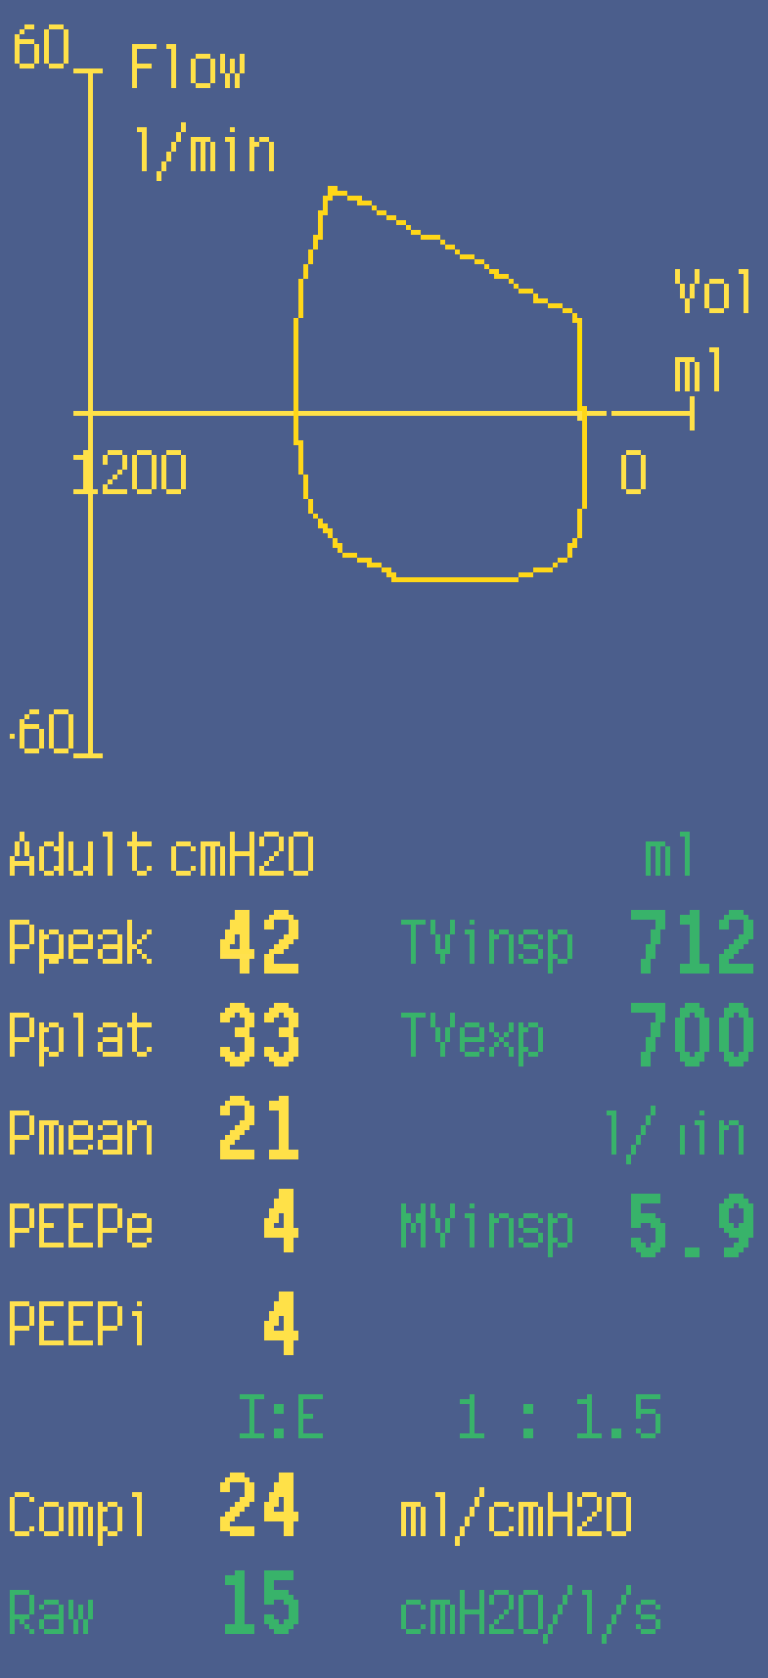
Presence of intrinsic PEEP can be seen as a loop, where the flow is not reaching zero line and also as an increased PEEPi value in the number field.
Intrinsic PEEP demonstrates air trapping situation which may lead to hyperinflation of the lung and increase the risk of the ventilation-induced lung injury.
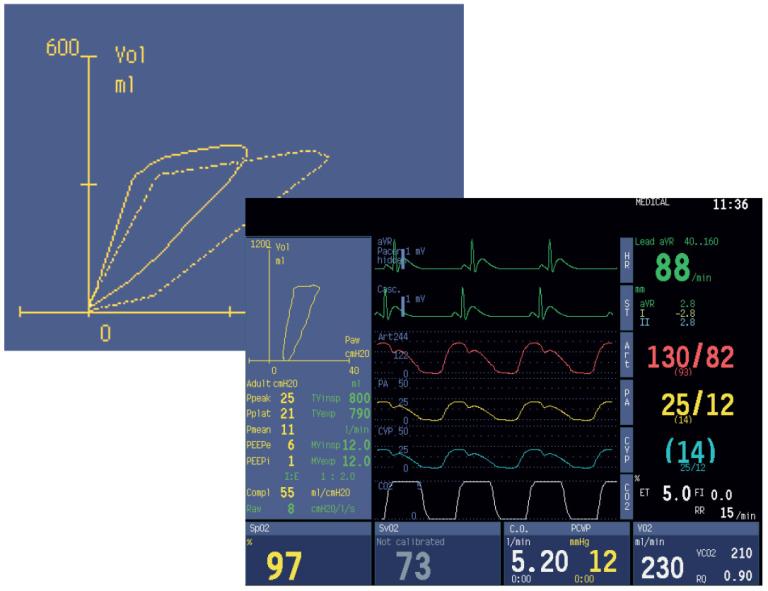
Best possible PEEP
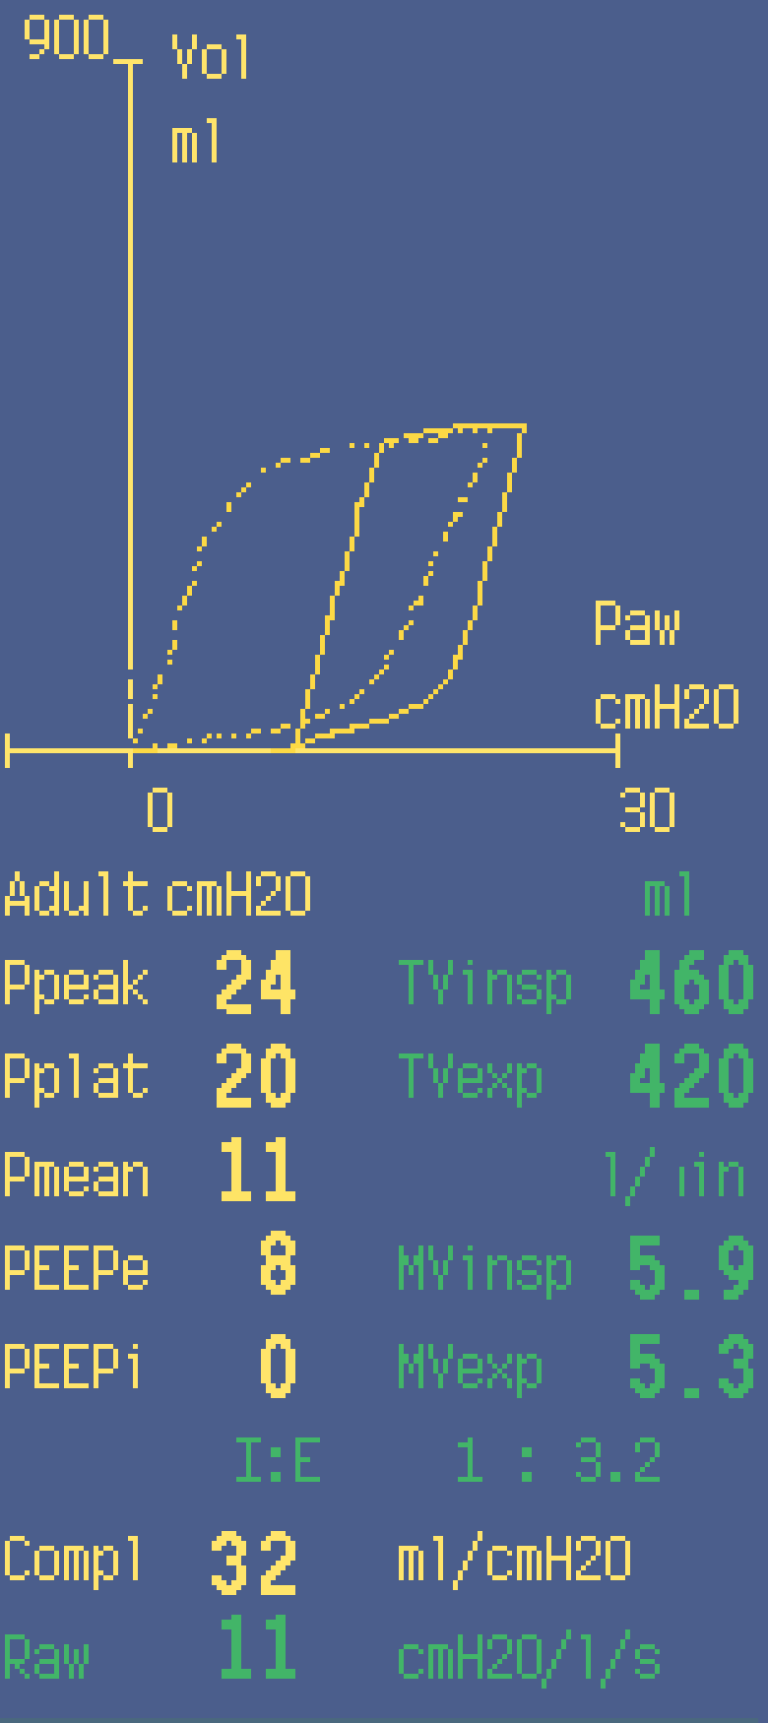
This figure demonstrates effects of different PEEP settings on patient compliance. The saved loop (1) illustrates decreased compliance.
The situation is altered by increasing PEEP setting to 8 cmH2O which clearly improves the lung
compliance (2).
Additional resources
For white papers, guides and other instructive materials about our clinical measurements, technologies and applications, please visit http://clinicalview.gehealthcare.com/

