Author: Jukka Takala, M.D. PhD
Professor of Intensive Care Medicine
Contents
- Foreword
- Introduction
- Methodological considerations of gas exchange measurements
- Bedside metabolic module
- Physiological aspects of gas exchange measurements
- Oxygen consumption
- Carbon dioxide production
- Respiratory quotient and respiratory exchange ratio
- Energy expenditure
- Methodological considerations of clinical applications
- Representative examples and case studies of the clinical application of gas exchange measurements
- Evolution of energy expenditure during prolonged intensive care
- Nutrition and ventilation
- Components of ventilatory demand
- Increase in ventilatory demand
- Measurement of alveolar ventilation
- Technical problems and physiological changes
- Summary
- Suggested reading
Equipment used for patient monitoring and clinical information system: GE HealthCare's modular monitors and Centricity High Acuity Critical Care clinical information system.
Foreword
The purpose of this booklet is to give an introduction to the basic principles and clinical applications of gas exchange measurements. The physiological and technical background is discussed briefly and demonstrative examples on the clinical applications are given.
Introduction
Recent advancements in medical technology have enabled accurate measurement of respiratory gas exchange in a wide variety of clinical conditions. The modern modular indirect calorimetric devices are easy to use, which facilitates routine clinical measurements. The clinical applications range from assessment of energy requirements to comprehensive analysis of ventilation and oxygen transport in patients with complex cardiorespiratory problems. Though the measurements can be made easily, accuracy and reproducibility of results require understanding of the basic principles of the measurement and related physiology. Furthermore, indirect calorimetry is sensitive to measurement errors; the need for routine procedures of quality control is therefore emphasized.
Despite accurate measurement, several clinical and physiological factors influence the results of gas exchange measurements and should be considered in interpretation. In this respect, the relationship between ventilation and gas exchange is of crucial importance. Any acute change in alveolar ventilation will be immediately reflected in CO2 -output, which will not measure the metabolic production of CO2 , until a new steady-state has been achieved. Similar, but shorter transients will be seen also in O2 - consumption. Analogously, acute changes in tissue perfusion may influence both tissue oxygen uptake and removal of CO2 from the tissues.
These issues will be discussed in more detail in the “Physiological aspects of gas exchange measurements” section.
Methodological considerations of gas exchange measurements
Indirect calorimetry devices for intensive care patients usually apply the open circuit technique, where the flow of gas is measured, and the inspiratory and expiratory concentrations of oxygen and carbon dioxide analyzed. Oxygen consumption (V̇O2) and carbon dioxide production (V̇CO2) are calculated from this data. Both the inspiratory and expiratory flows must be measured or, more commonly, one of the flows measured and the other one estimated using the Haldane transformation. The Haldane transformation assumes that only O2 and CO2 are exchanged in the lungs and the rest of the respiratory gases (excluding water vapor) have the same volume in both inspiratory and expiratory gases. When one of the flows is known, the other one can be calculated. Measurement of respiratory gas flow continuously is associated with several problems, such as the effects of humidity, alternating gas composition, secretions, and the dynamic response of the flow sensors. Complicated compensation and calibration algorithms, and frequent cleaning are required to eliminate these effects. The problems of flow measurement were solved in a unique and robust fashion in the Deltatrac devices, which used a constant flow generator and gas dilution principle. These devices became the reference method for gas exchange measurements of both ventilated and spontaneously breathing, severely ill patients. This device is no longer in production.
Bedside metabolic module
Gas exchange measurement technologies have been integrated in both mechanical ventilators and patient monitors. Combined measurement of airway gases and flow enables continuous monitoring of oxygen consumption and carbon dioxide production with intubated patients. Since measurement of oxygen consumption is more challenging than that of CO2 -production, some devices measure only the CO2 -production. If both V̇O2 and V̇CO2 are measured, energy expenditure and respiratory quotient can then also be calculated.
The GE HealthCare modular monitors provide a modular measurement unit for gas exchange measurements. The gas module uses side-stream gas sampling and contains a paramagnetic sensor to measure the O2 curve and an infrared sensor for the CO2 curve. A special connector with gas sampling ports and a flow sensor is connected between the ventilator tubing and the artificial airway. The flow measurement is based on the pressure drop across a special proprietary turbulent flow restrictor. Breath-by-breath measurement of pulmonary gas exchange is technically demanding and requires sophisticated compensation and data processing algorithms to achieve the accuracy required in the clinical use.
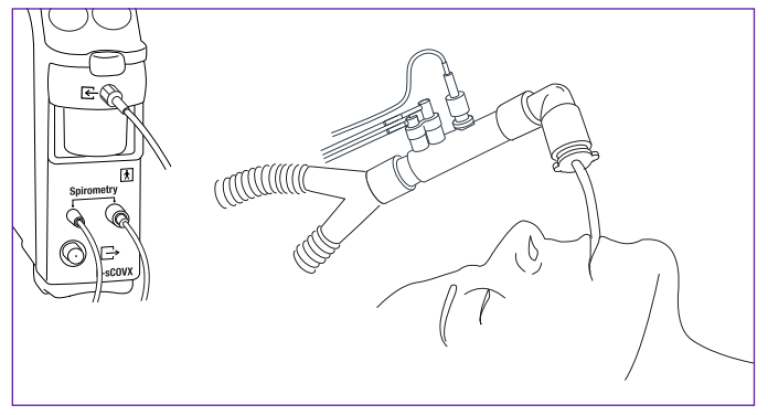
Because of the side-stream principle the measurements of gas concentrations and flow are not simultaneous. When a gas sample passes through the flow sensor, the flow signal is recorded with a negligible delay (less than 10 ms) since the pressure difference propagates to the module through the spirometry tubing with the speed of sound. In contrast, it takes about 1.5 seconds for the gas to travel through the sampling line to the module where its O2 and CO2 concentrations are measured
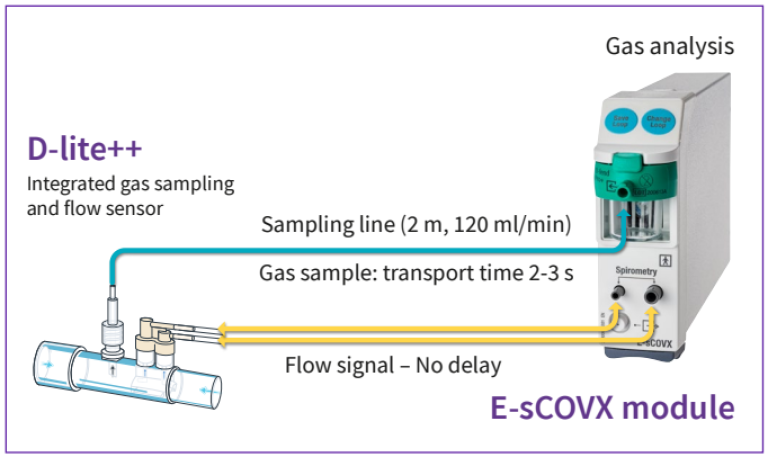
The transport time delay is not constant, but must be compensated for the fluctuations in the sample flow caused by variations in the pressure at the flow sensor and changes of the gas concentration.
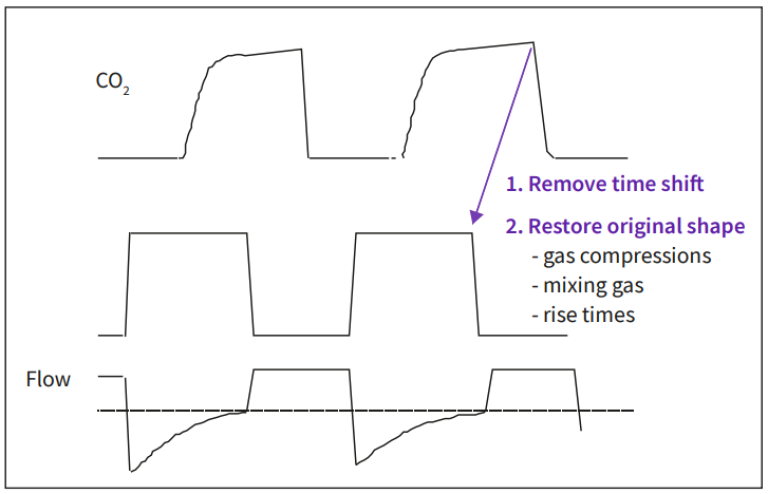
In addition to these the finite rise times of the O2 and the CO2 sensors also need to be compensated utilizing a deconvolution algorithm.
After reconstructing the original waveforms of the gas concentrations and shifting the curves to match the flow signal, the final calculations are based on a mathematical integration operation of the product of the flow and each gas signal. Additionally the Haldane transformation is applied to avoid the need of absolute accuracy of the volume measurement in both flow directions. The Haldane transformation assumes no nitrogen exchange in the lungs. Accordingly, oxygen consumption can calculated as
V̇O₂ = minute ventilation * (FiO₂ – FeO₂- FiO₂*FeCO₂)/(1-FiO₂),
where FiO₂ and FeO₂ are, respectively, the inspiratory and expiratory oxygen fractions and FeCO₂ the expiratory CO₂-fraction.
Any technique that applies the Haldane transformation makes the measurement inherently error-prone at high inspiratory oxygen fractions, since the difference between inspired and expired oxygen concentration as well as the denominator term, 1-FiO2 , become very small – in practice, FiO2 of up to 0 .70 can be considered as a limit – with special care to reduce all sources of error, reliable measurements at a maximum FiO2 of 0.85 may be achieved.
Physiological aspects of gas exchange measurements
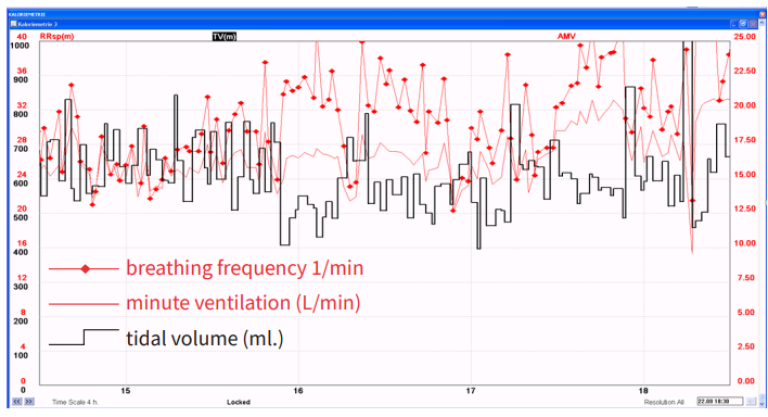
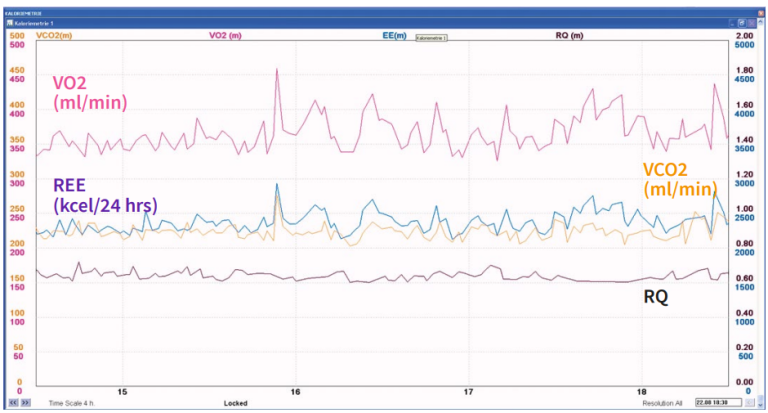
Even if gas exchange can be measured breath by breath, a period of at least 20-30 minutes is preferable for metabolic monitoring purposes, since a longer measurement period will give more valid information on the average gas exchange. Rapid, transient variations in gas exchange may be physiological, for example, when caused by altered physical activity or state of alertness, or artefacts, e.g. if the inspiratory gas concentrations are unstable or a change in the breathing pattern induces an abrupt change in the inspiratory or expiratory gas concentrations. Since current clinical practice favors the use of ventilation modes that preserve spontaneous breathing activity, variation of breathing pattern is very common in intensive care patients, and should be considered in the interpretation of gas exchange measurements. The example shown below demonstrates the impact of increased variability on breathing pattern (Figure 4) on the variation of gas exchange variables (Figure 5).
Oxygen consumption
Indirect calorimetry measures oxygen consumption as the uptake of oxygen from the respiratory gases. Acute changes in ventilation, hemodynamics, and physical activity may induce wide variations in the V̇O2 measured by any method. Since V̇O2 can be measured continuously, the transient changes in the measured V̇O2 can be readily observed in prolonged measurements.
Under aerobic conditions, V̇O2 depends on the metabolic activity of the tissues. At a given metabolic rate, the substrates of energy metabolism also have an impact on the V̇O2, since the amount of oxygen required to produce the same amount of energy from different substrates varies. The amount of oxygen needed to produce 1 kcal of energy from carbohydrate is 207 ml, from fat 213 ml, and from protein 223 ml.
If the amount of oxygen delivered to the tissues is inadequate for metabolic needs, tissue oxygen consumption becomes dependent on oxygen delivery and anaerobic metabolism with lactic acid production will ensue. During anaerobic metabolism, the V̇O2 measured from the respiratory gases does not reflect the tissue oxygen needs, since an oxygen debt develops in the tissues. When aerobic conditions are restored, the oxygen debt will be reflected as increased oxygen consumption
Carbon dioxide production
Measurement of carbon dioxide production (V̇CO2) by indirect calorimetry is susceptible to major errors unless the close relationship between V̇CO2 , alveolar ventilation (VA), and arterial CO2 (PaCO2 ) is taken into account. According to the classical Bohr’s equation, V̇CO2 = VA x PaCO2 /k, where k is a constant that depends on the units and the conditions (pressure, temperature, humidity) of the measurement. When V̇CO2 is given in ml/min, standard temperature (0°C), and dry gas (STPD), VA is given in L/min, 37 °C, and fully saturated with water vapor (BTPS), and PaCO2 in kPa, the constant is equal to .1150. The Bohr’s equation demonstrates that the measurement of V̇CO2 is sensitive to changes in ventilation: any change in alveolar ventilation will be directly reflected in V̇CO2 until a new steady state of PaCO2 has been achieved.
In a steady state, V̇CO2 depends on the metabolic activity of the tissues and, similar to V̇O2 , on the substrates of the energy metabolism. Production of 1 kcal of energy from carbohydrate produces 207 ml of CO2 , from fat 151 ml, and from protein 181 ml. If any of the variables in the Bohr’s equation changes, the body CO2 - pool will change. Under these circumstances, enough time should be allowed for the body pool of CO2 to stabilize, if the measured V̇CO2 should reflect the metabolic production of CO2 . The time required for the stabilization varies widely and ranges from 30 to 120 minutes. Continuous measurement of gas exchange facilitates the verification of a steady state.
An example of the effect of an acute change in breathing pattern on gas exchange measurements is shown below in Figure 6.
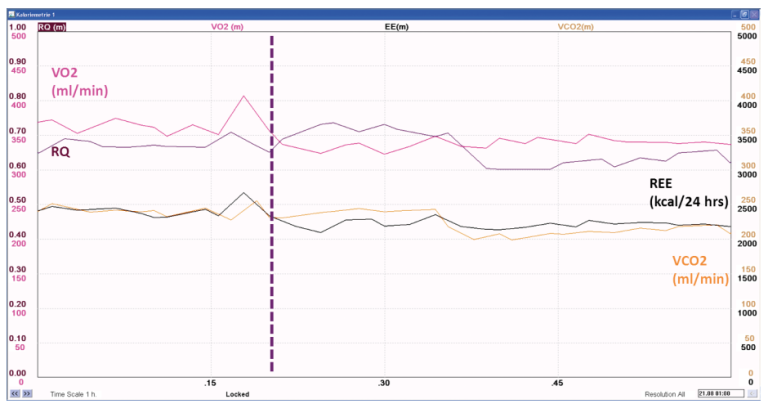
The vertical dashed blue line shows the time point of an abrupt change in breathing pattern, with initially increasing tidal volume and decreasing frequency and minute ventilation, with subsequent decrease in tidal volume and increase in breathing frequency with preserved minute ventilation at the reduced level.
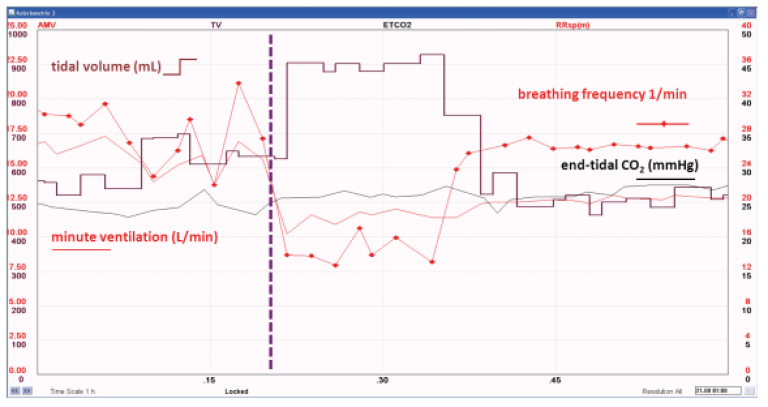
The apparent decrease in V̇CO₂, RQ, and REE result from the decreased alveolar ventilation, reflected as gradually decreasing end-tidal CO₂. A new steady state needs to be established, before the measured V̇CO₂, RQ, and REE reflect the true metabolic activity, as seen in Figure 7.
Respiratory quotient and respiratory exchange ratio
The ratio between V̇CO2 and V̇O2 is called the respiratory quotient (RQ), when measured in steady state conditions. In non-steady state conditions, the expression “respiratory exchange ratio” is more appropriate. Assuming steady state conditions, the RQ reflects the mixture of substrates utilized by the energy metabolism. The RQ of carbohydrate is 1, the RQ of fat 0.7 and the RQ of protein approximately 0.81 Detailed analysis of substrate oxidation requires measurement of urinary urea excretion for the assessment of protein oxidation and calculation of the non-protein RQ. For clinical purpose, major shifts in substrate oxidation will be reflected in the total RQ, as measured directly from the respiratory gases. see Table 1.
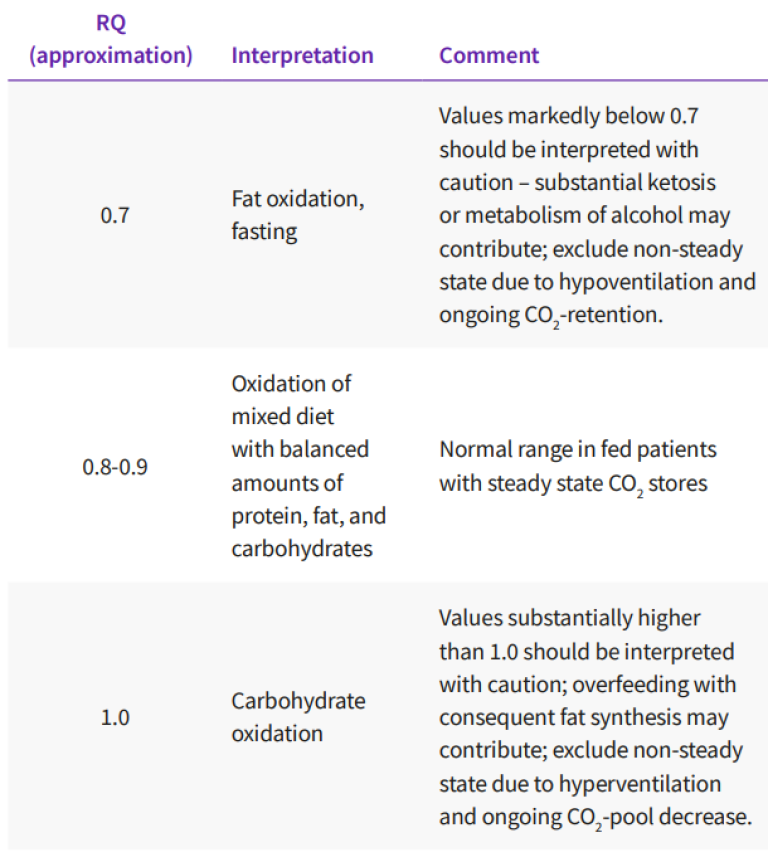
Interpretation of total RQ from respiratory gas exchange measurements, assuming a steady state gas exchange – to verify steady state, a recording of at least 30 minutes is necessary.
Increased glucose oxidation will be observed as an RQ approaches 1, whereas increased fat oxidation will result in an RQ approaches 0.7. A steady state RQ above 1 indicates fat synthesis and is a clinical rarity, associated with excessive carbohydrate feeding.
Even in these conditions, the RQ rarely exceeds 1.3. A steady state RQ below 0.7 is also a rarity, but may occur during ketosis, if the ketone bodies are incompletely oxidized and excreted into the urine. RQ-values exceeding 1 and below 0.7 should be carefully examined for measurement errors and the lack of a steady state. The most common causes of RQ-values >1 or <0.7 are changes in ventilation: hyperventilation will increase the RQ and hypoventilation will decrease it, until a new steady state of body CO2 -pool has been achieved. As pointed out before, this may require up to 120 minutes after an abrupt change. Analogously, the development of an oxygen debt will increase the RQ, whereas replenishment of an oxygen debt will reduce the RQ. Accurate measurement of RQ in mechanically ventilated patients is difficult due to the inherent instability of the underlying clinical conditions. Of note, RQ should be assessed over a longer period of time, a minimum of 30 minutes of verified relative steady state, and calculated as the ratio of the mean V̇CO2 and mean V̇O2 , not as the average of breath-by-breath or minute-to-minute RQs provided by the measurement devices.
Energy expenditure
The energy expenditure cannot be directly measured by indirect calorimetry, but has to be calculated from the measured gas exchange variables and protein oxidation. The relative contribution of protein oxidation to the total energy expenditure is small even in catabolic conditions, and can be estimated or ignored without inducing a major error in the estimated energy expenditure. Several formulas are available for this purpose and the Weir formula is perhaps the most commonly "utilized". When V̇O2 and V̇CO2 are given in ml/min STPD, and urinary urea nitrogen in g/day, energy expenditure in kcal/day
EEadult = (5.509 x V̇O2 )+ (1.752 x V̇CO2 )– (2.056 × Un) (kcal/day)
where Un = Urea nitrogen excretion = 13 g/day (for adults only)
EEpedi= (5.509 x V̇O2 ) + (1.752 x V̇CO2)
Resting normal values for V̇O2 and V̇CO2 vary according to the body size, age, and sex of the patient. Rough estimates of normal values can be obtained, for example, by the Harris-Benedict formula, which is based on studies in healthy volunteers in 1919. Several studies have re-evaluated this formula, and indicated that it predicts the resting energy expenditure relatively accurately in healthy subjects, excluding extremes of body mass index. Other predictive formulas have been developed more recently. Nevertheless, several studies have consistently demonstrated that actual energy expenditure is difficult to predict in the hospitalized patients in general, and specifically, in the mechanically ventilated intensive care patient. (see e.g.Boullata et al 2007, Kross et al 2012) .
An increase in energy expenditure will be reflected as a proportional increase in both V̇O2 and V̇CO2 . Temporary increase of up to 200% can occur due to e.g. shivering and convulsions. Clinical conditions associated with hypermetabolism, for example, injury and sepsis, typically increase the energy expenditure by 25-40%, but the variability between patients is high. Also an individual patient may have large changes, e.g. during at the onset and resolution of a septic episode. Patients with severe pulmonary pathology and impairment of respiratory mechanics may have markedly increased work of breathing: the oxygen cost of breathing can be up to 20% of whole body V̇O2 , whereas it normally represents less than 5% of the total V̇O2 . Hemodynamic catastrophes, such as a circulatory collapse, may acutely reduce both V̇O2 and V̇CO2 , and a compensatory increase will be observed, once adequate tissue perfusion has been restored.
Methodological considerations of clinical applications
Gas exchange measurement in the mechanically ventilated patient is prone to several potential sources of error:
- High positive pressures in the ventilator patient circuit may influence the gas analyzers.
- Haldane transformation cannot usually be used at high inspiratory fractions of oxygen. In practice, 0 .60-0.70 (60 to 70 %) is the upper limit.
- Instability of inspiratory oxygen fraction due to the characteristics of the gas blender and variation of the pressure of gases in the gas sources – this source of error is less relevant, when gas concentrations are measured breath by breath using rapid response sensors
- Leaks in the ventilator-patient circuit.
- Temperature and humidity.
The errors related to the positive pressures and the effects of temperature and humidity can only be avoided by proper instrument design. Inspiratory oxygen concentrations can be stabilized by use of a mixing chamber (such as the humidifier) – high variation in inspiratory oxygen fraction suggests poor oxygen blender characteristic, or instability of the hospital gas supply pressure. In this case, the blender should be checked, and proper measures taken to stabilize the hospital gas supply pressure.
The various techniques of ventilatory support may create both technical and physiological problems in the interpretation of the results. The variation of the inspiratory oxygen fraction is likely to be least during controlled mechanical ventilation, whereas more variation due to the technical characteristics of the gas blenders can be expected during other modes of ventilatory support. In addition, a variable breathing pattern will inevitably increase the physiological variation of gas exchange. The effects of both the technical (e.g., FiO2 - variation) and the breathing pattern induced variation the measured mean values can be minimized by prolonging the measurement. Since acute changes in physical activity and stress may acutely change metabolic activity, these should be avoided when steady state measurements are attempted
Representative examples and case studies of the clinical application of gas exchange measurements
Prolonged need for nutritional support in mechanically ventilated patients
In patients with uncomplicated recovery, oral feeding can be reinstituted rapidly and even gross errors in estimated energy needs are clinically irrelevant. Approximately 10% of intensive care patients require prolonged intensive care. The average degree of hypermetabolism in groups of patients with sepsis, trauma or severe postoperative complication can be relatively well predicted – typical responses in ICU patient groups are summarized in Figure 8.
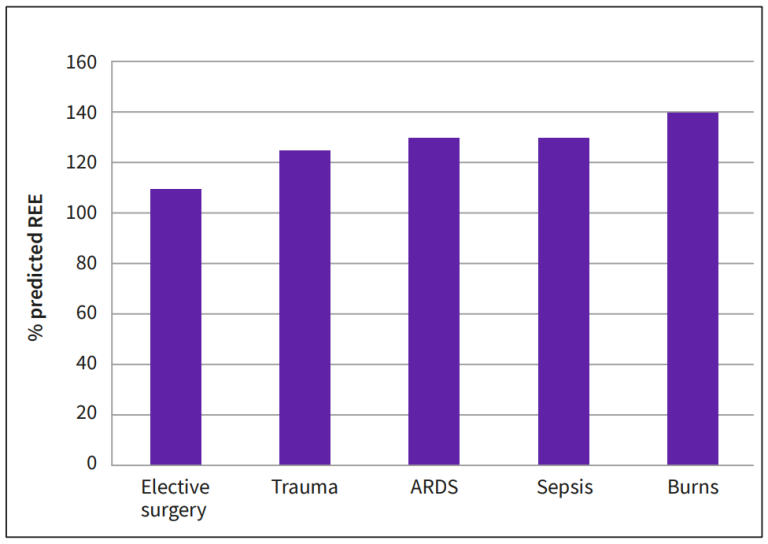
Intercurrent infections, surgical interventions, and changes in the activity of the patient lead to wide variation in the energy expenditure and consequently, risk for inadequate nutrition is obvious. Prolonged negative energy balance may interfere with wound healing and rehabilitation, and overfeeding may increase the ventilatory demand during a period, when the patient’s ventilatory function is compromised.
Evolution of energy expenditure during prolonged intensive care
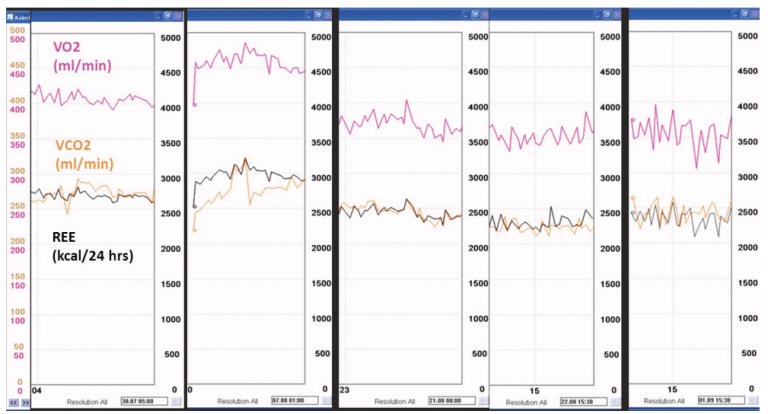
Figure 9 demonstrates the variation of energy expenditure in a patient, who initially developed severe complications after bariatric surgery. The postoperative course was complicated by repeated septic episodes including septic shock, acute respiratory failure and need for several reoperations. The patient was highly febrile over several weeks, and dependent of artificial nutrition, delivered enterally, parenterally, or in combination. Her actual energy expenditure ranged between 2300 and 3000 kcal/24 hrs
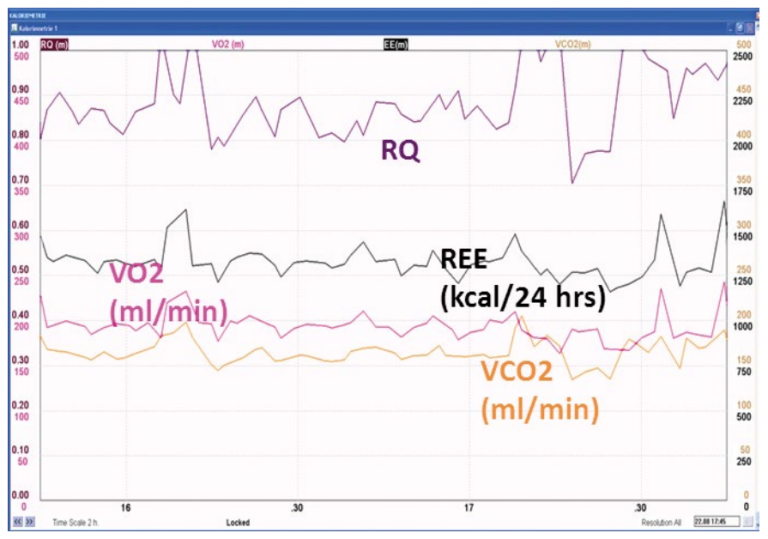
Another example of problems in estimating energy needs during prolonged intensive care is a patient, who suffered multiple complications after a Whipple operation, a protracted wound dehiscence and multiple episodes of sepsis. Several months after the initial operation the patient was admitted from rehabilitation to a hospital for definitive wound revision and closure. She developed another episode of sepsis and signs of metabolic encephalopathy postoperatively, and was admitted to the tertiary center intensive care unit one week after the last operation. The patient was hemodynamically stable. Her estimated resting energy expenditure (based on the Harris-Benedict formula) was 1480 kcal/24 hrs.
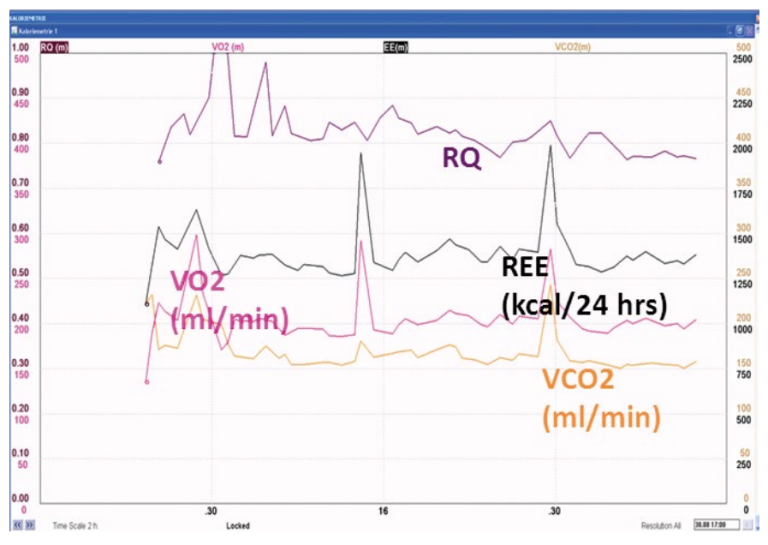
An indirect calorimetry was performed due to uncertainty of nutritional requirements after the complex history. This revealed a pattern of hypometabolism, with an actual energy expenditure of around 1300 kcal/24 hrs persisting over the first two weeks of intensive care. Figure 10 below shows examples of gas exchange measurements at the end of the first and second week in the ICU, demonstrating persisting hypometabolism.
Since both gross overfeeding and prolonged negative energy balance can be harmful, measurement of energy expenditure remarkably helps the design and maintenance of adequate nutrition in these patients.
Nutrition and ventilation
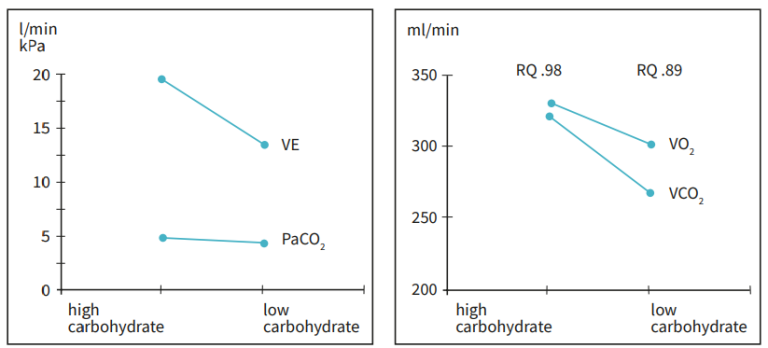
Muscular wasting as the result of malnutrition or catabolism will inevitably also influence the performance of the respiratory muscles. Nutritional support may increase the ventilatory demand by increasing the CO2 -production. CO2 -production increases, if large amounts of energy, especially carbohydrates are given with a consequent increase in RQ. In rare cases overfeeding with large loads of carbohydrate may induce lipid synthesis. The consequent increase in CO2 -production will be large. However, in patients with severely compromised ventilatory function, even relatively small shift in RQ can be critical in terms of the demand for minute ventilation. Figure 11 below shows the changes in RQ, gas exchange and ventilatory demand in a patient with respiratory failure and prolonged ventilator dependency, where increasing the intake of lipids and the consequent reduction of RQ facilitated weaning. The measurement of gas exchange helped to maintain sufficient energy supply and make sure that the desired response to the nutritional manipulation was achieved. Since both overfeeding and malnutrition may cause weaning difficulties, measurement of gas exchange and energy expenditure can be helpful in patients requiring prolonged mechanical ventilation. The interaction between metabolism and ventilator demand is discussed in more detail in the next paragraph.
Components of ventilatory demand
Measurement of gas exchange can be used to evaluate the components of increased ventilatory demand, by considering the components of the Bohr’s equation.
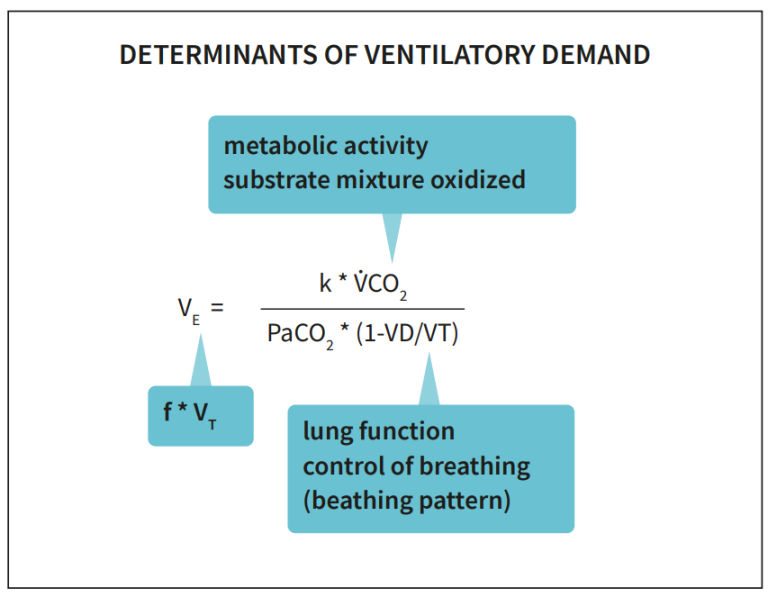
k=0.1150, when VE is expressed in L/min (BTPS), V̇CO₂ in ml/min (STPD), PaCO₂ in kPa. VD/VT: dead space to tidal volume ratio, an indicator of efficiency of CO₂-removal.
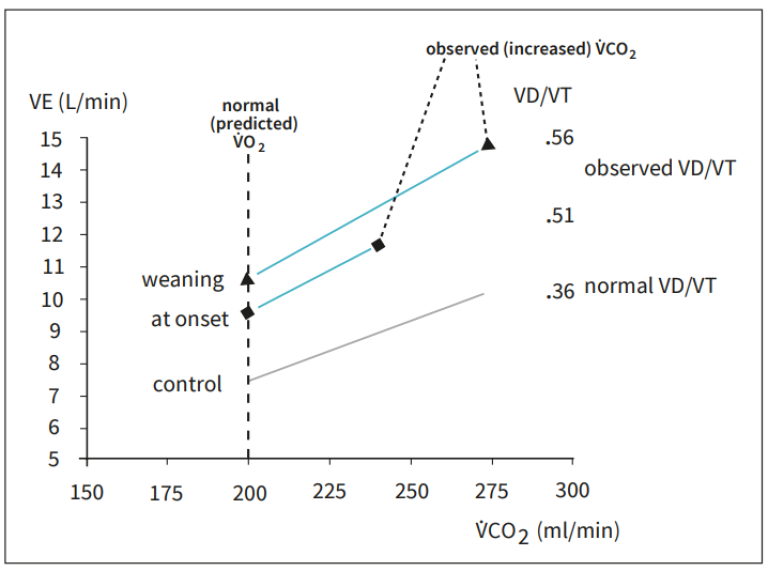
An increased V̇CO2 due to hypermetabolism can markedly increase the ventilatory demand and even be the main component of it. Treatment of pain and anxiety, fever, and sources of infection and inflammation help to reduce the degree of hypermetabolism. As can be seen from the Bohr’s equation, the increase in ventilatory demand due to increased V̇CO2 becomes more relevant, when the VD/VT is increased. Similarly, an increase in ventilatory demand can be compensated for by allowing a higher PaCO2 . These relationships can be demonstrated graphically Figure 13.

Measurement of gas exchange can help to evaluate the components of increased ventilator demand, and thereby the causes of ventilator dependency, see Figure 14.
Increase in ventilatory demand
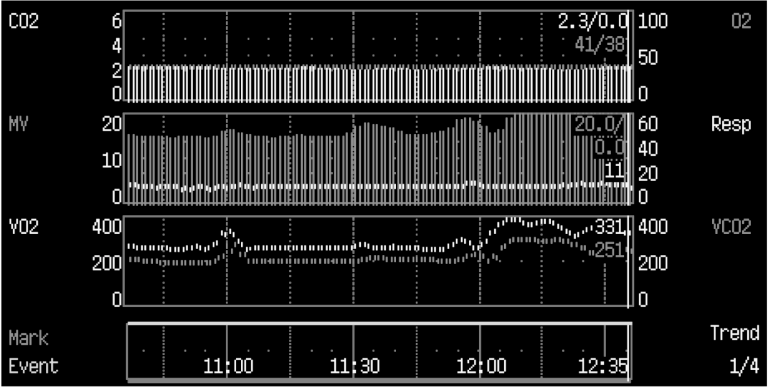
An elderly male patient was admitted to intensive care due to acute respiratory failure related to postoperative peritonitis and sepsis. He was intubated and mechanically ventilated on assist/control mode of ventilation. On the second day of intensive care, at 12:10 AM the patient had an acute increase in minute ventilation from 15 l/min to more than 20 l/min, while his end-tidal CO2 and arterial oxygen saturation (pulse oximetry) remained stable. Physical examination did not reveal any relevant changes, except an acutely increased ventilatory drive, and arterial blood gas analysis confirmed unchanged PaO2 and PaCO2 .
The CO2 -production had acutely increased from around 200 ml/ min to more than 300 ml/min. This increase, related to an acute onset of bacteremia was the sole cause of the increase in ventilatory demand. The onset of sepsis may also worsen lung function and increase ventilatory demand also by increasing the VD/VT, although an unchanged end-tidal to arterial CO2 -ratio effectively excludes this possibility.
Measurement of alveolar ventilation
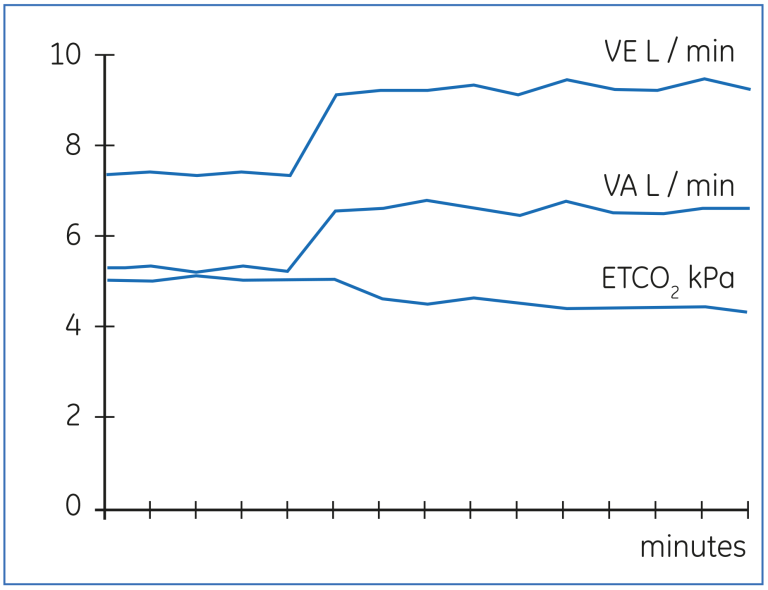
The Bohr’s equation can also be applied to measure changes in alveolar ventilation in response to altered ventilator settings. The advantage of this technique is that the achieved level of alveolar ventilation is detected promptly, whereas changes in PaCO2 or end-tidal CO2 will continue, until a new steady state in the body CO2 -pool has been achieved. Figure 16 below demonstrates the change in VA in response to increased minute ventilation. The final level of VA could be observed in 2 - 3 minutes, whereas both end-tidal CO2 (ETCO2 ) and PaCO2 will continue to change up to 60 - 90 minutes. By utilizing the gas exchange measurement, the response to major changes in ventilator setting can be observed more rapidly
Technical problems and physiological changes
Figures 17 through 20 demonstrate some technical problems and physiological changes, which may interfere with the results or the interpretation. Figure 17 below shows an artefactually high V̇O₂ and low RQ, which result from a leak in the expiratory gas circuit. As shown, the effect on V̇CO₂ is much smaller.
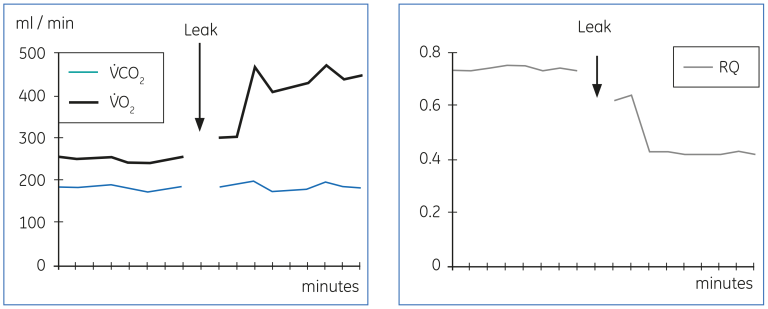
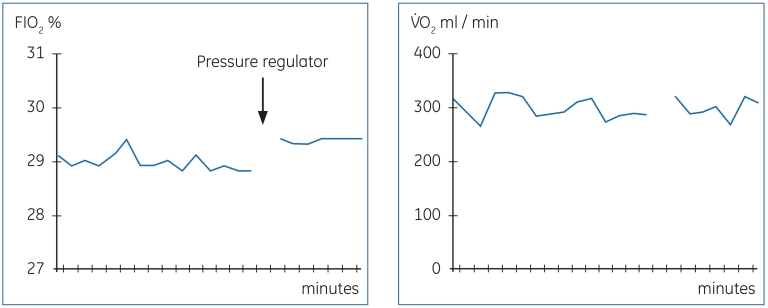
Figure 18 below shows a phenomenon, which is relatively common in hospital pressurized gas supply systems. The variation of pressure in the gas supply will influence the performance of the gas blender and result in varying FIO₂. This is reflected in the measured V̇O₂ as additional variation. The variation can be reduced by the use of pressure regulator, as shown in the figure. The remaining variation in the measured V̇O₂ is mostly physiological, caused by variations in breathing pattern, which is common during ventilator modes allowing spontaneous breathing. This patient was on a low frequency synchronized intermittent mandatory ventilation with pressure support.
The effect of the ventilator mode on the stability of FIO₂ is shown in Figure 19 below. The relatively stable FIO₂ during controlled mechanical ventilation is markedly unstable, when the patient is switched to CPAP.
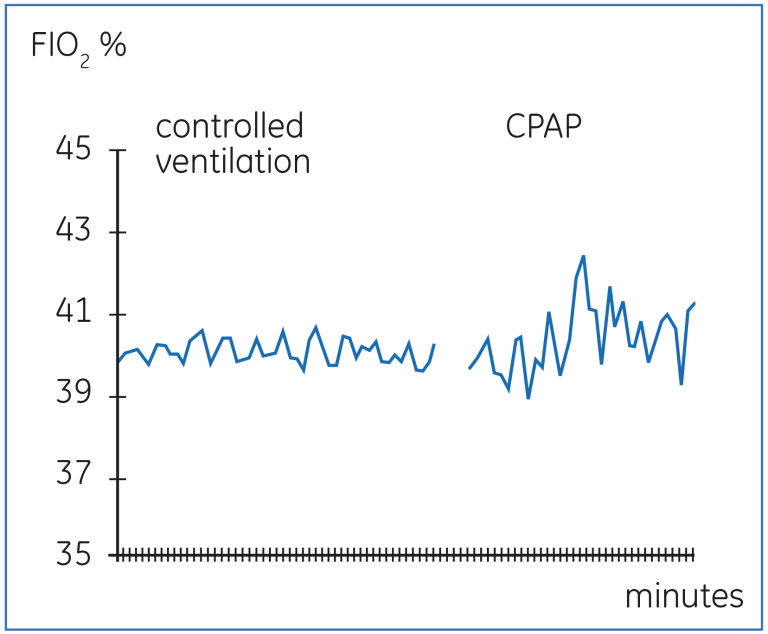
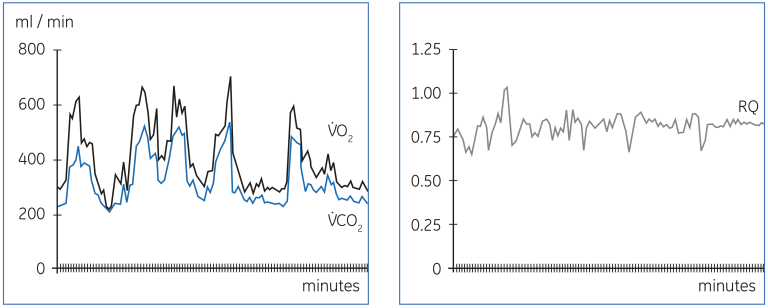
Figure 20 demonstrates the wide variation in V̇O₂ and V̇CO₂ caused by rapid changes in the metabolic demands, in this case due to major epileptic seizures in a patient with intracranial injury. Other factors that may modify the metabolic demands include fever, pain and anxiety. It is important to consider the potential alterations in the basic metabolic requirements, when results of gas exchange measurements are interpreted.
Summary
Compact devices for measurement of gas exchange in the clinical setting have now been available for several years. This has increased our understanding of the nutritional requirements and response to nutrition in various disease states and opened up new insights to the pathophysiology and management of life-threatening respiratory and hemodynamic problems. The need to measure the actual energy expenditure in some groups of patients with prolonged nutritional problems has also become more evident. This progress will most likely make measurement of gas exchange an integral part of clinical monitoring in the intensive care unit. While the technology for accurate gas exchange measurements is available, accuracy and reproducibility of results requires understanding of the basic principles of the measurement technique, the underlying physiology, and that meticulous attention is paid to the details of the measurement procedure.
Suggested reading
Heidegger, C.P. et al. Optimisation of energy provision with supplemental parenteral nutrition in critically ill patients: a randomised controlled clinical trial. Lancet. 2012 Dec 3 (epublished ahead of print)
Bursztein, S. et al. Energy metabolism, indirect calorimetry, and nutrition. Williams & Wilkins, Baltimore, MD, USA, 1989
Boullata, J. et al. Accurate determination of energy needs in hospitalized patients. J Am Diet Assoc. 107, 393-401 (2007).
Kross, E.K. et al. A comparison of predictive equations of energy expenditure and measured energy expenditure in critically ill patients. J Crit Care 27, 321 (2012).
Snyder, J.V. and Pinsky, M.R. eds., Oxygen transport in the critically ill. Year Book Medical Publishers, Inc., Chicago, London (1987).
Nunn, J.F., Applied respiratory physiology, 3rd ed. Butterworths, London (1987).
Kinney, J.M. et al. The intensive care patient, in Nutrition and metabolism in patient care (Kinney, J.M. et al. eds.) W.B. Saunders Company, Philadelphia, pp. 656-671 (1988).
Bessey, P.Q. and Wilmore, D.W. The burned patient, in Nutrition and metabolism in patient care (Kinney, J. M. et al. eds.) W.B. Saunders Company, Philadelphia, pp. 672-700 (1988).
Rothkopf, M.M. et al. Nutritional support in respiratory failure. Nutrition in Clinical Practice 4, 166-172 (1989).
Meriläinen, P.T. Metabolic monitor. Int J Clin Monit Comp 4, 167-177 (1987).
Braun, U. et al. Evaluation of methods for indirect calorimetry with a ventilated lung model. Int Care Med 15, 196-202 (1989).
Takala J, et al. Measurement of gas exchange in intensive care: Laboratory and clinical validation of a new device. Crit Care Med 17, 1041-7 (1989).
Lanschot, J.J.B. et al. Accuracy of intermittent metabolic gas exchange recordings extrapolated for diurnal variation. Crit Care Med 16, 737-742 (1988).
Schumacker, P.T. and Cain, S.M. The concept of a critical oxygen delivery. Intens Care Med 13, 223-229 (1987).
Shoemaker, W.C. et al. Therapy of shock based on pathophysiology, monitoring and outcome prediction. Crit Care Med 18, 19-25 (1990).
Askanazi, J. et al. Influence of total parenteral nutrition on fuel utilization in injury and sepsis. Ann Surg 191, 40 (1980).
Roulet, M. et al. A controlled trial of the effect of parenteral nutritional support on patients with respiratory failure and sepsis. Clin Nutr 2, 97 (1983).
Shaw, S.N. et al. Effects of increasing nitrogen intake on nitrogen balance and energy expenditure in nutritionally depleted adult patients receiving parenteral nutrition. Am J Clin Nutr 37, 930 (1983)
Pitkänen, et al. Nitrogen and energy balance in depleted patients undergoing major gastrointestinal surgery: response to TPN. Clin Nutr 10, 36-42 (1991).
Grote, A.E. et al. Nutritional and metabolic effects of enteral and parenteral feeding in severely injured patients. Clin Nutr 7, 161-167 (1987).
Jeevanandam, M. et al. Influence of parenteral nutrition on rates of net substrate oxidation in severe trauma patients. Crit Care Med 18, 467-473 (1990).
Al-Saady, N.M. et al. High-fat, low-carbohydrate enteral feeding lowers PaCO2 and reduces the period of ventilation in artificially ventilated patients. Intens Care Med 15, 290-295 (1989).

